
Integrate with Telemetry Data Collectors
Introduction
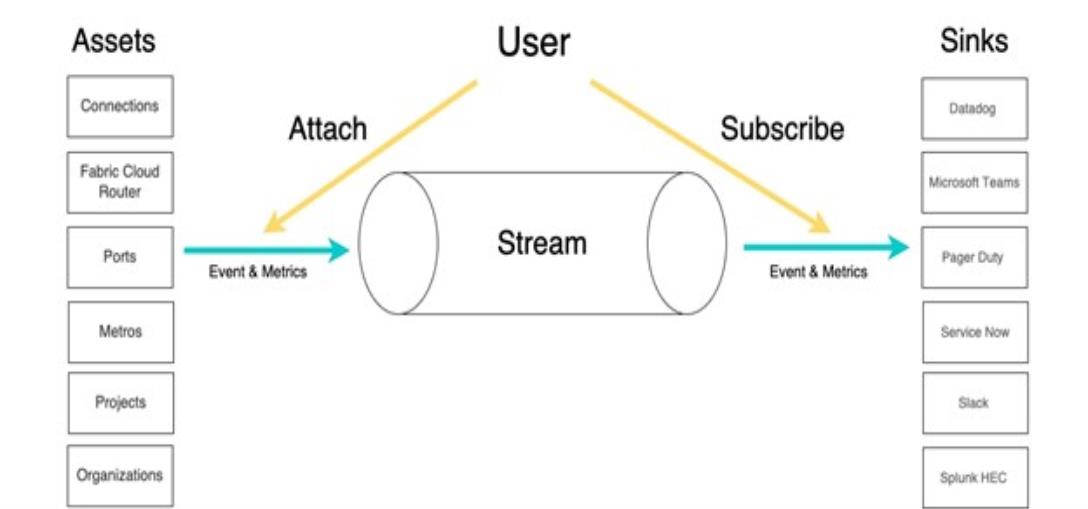
This architecture diagram demonstrates how observability components work with each other. Stream creation is the starting point where the Fabric user creates a new stream, which will hold and organize several types of assets. Once the stream is created, the user can attach Fabric resources (like connections, cloud routers, etc.) as assets to the stream. This step ensures that event messages related to these assets are captured in the stream.
With the assets attached, the stream starts receiving event messages, including metrics associated with the attached assets. After setting up the stream, the user subscribes to it to begin receiving updates about the events occurring within it. On subscription, the user selects a sink for these event messages, with the supported sinks (like Splunk, Datadog, etc.). The user can filter the event messages based on specific fields. Finally, once everything is set up, the user receives the event messages from the stream, directed to the chosen sinks, where they can be analyzed or acted upon.
Steps for configuring data collector
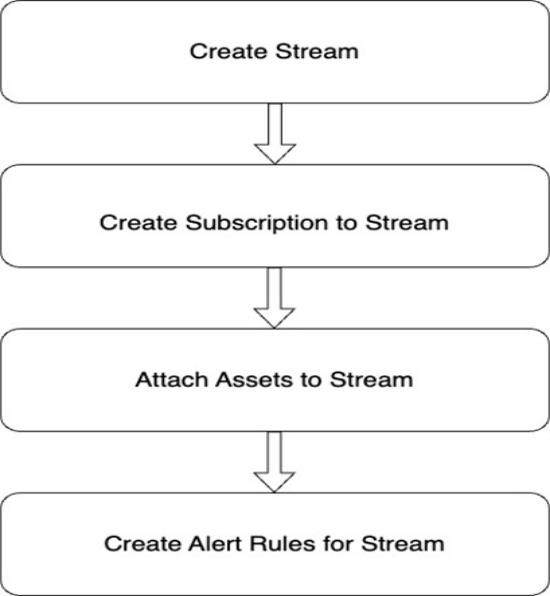
The flow diagram illustrates a typical use case for configuring a data collector. The flow begins with the creation of a stream, followed by the subscription to that stream. Once subscribed, the user attaches assets to the stream, ensuring that the relevant event messages are captured. Optionally, the user can create alert rules to define specific conditions for triggering notifications or actions based on the event data. This flow represents a streamlined approach to configuring the data collector for event monitoring and management.
Data Collector Setup
You can collect event or metric data using various Sink Types, each designed to streamline data handling and processing. These Sink Types enable you to direct your data to preferred destinations like Splunk or Datadog for advanced analytics, or PagerDuty or Slack for real-time alerts. Set up Sink Types using the documentation below.
Here's a list of what we support:
| Sink Type | Observability Data Type | ||
|---|---|---|---|
|
|||
| Datadog | Supported | Supported | |
| Microsoft Teams | Supported | Supported | |
| Pager Duty | Supported | Not Supported | |
| Service Now | Supported | Not Supported | |
| Slack | Supported | Supported | |
| Splunk HEC | Supported | Supported | |
How to Manage Streams
A stream is a logical entity created through the Stream Management APIs. It allows you to organize telemetry data from resources that share the same set of subscriptions.
Step 1: Authenticate
Submit your user credentials, Client ID and Client Secret for OAuth2 authentication.
Refer to Generating Client ID and Client Secret.
Note: To use Observability APIs, the user must have the Fabric Stream Subscription Manager role. Refer to the IAM documentation to get roles assigned to a user.
Step 2: Create Streams
Once your Assets are created, you will need to create a Stream to manage these Assets. Call POST /fabric/v4/streams to create a Stream.
Sample curl request
curl -X 'POST' \
     'https://api.equinix.com/fabric/v4/streams' \
  -H 'accept: application/json' \
  -H 'Content-Type: application/json' \
  -H 'Authorization: Bearer <Bearer Token>' \
-d
'{
    "type": "TELEMETRY_STREAM",
    "name": "splunk1",
    "description": "subscription 1",
    "project": {
        "projectId": "300014703"
    }
}'
Response
{
    "uuid": "241372e9-79c9-4ef8-b77a-8b8176c2098b4",
    "href": "https://api.equinix.com/fabric/v4/streams/241372e9-79c9-4ef8-b77a-8b8176c228b4",
    "type": "TELEMETRY_STREAM",
    "name": "splunk1",
    "description": "subscription 1",
    "project": {
        "projectId": "300014703"
    },
    "enabled": true,
    "state": "PROVISIONING",
    "assetsCount": 0,
    "streamSubscriptionsCount": 0,
    "changelog": {
        "createdBy": "testuser",
        "createdDateTime": "2024-08-12T21:14:17.689103902Z"
    }
}
Step 3: Retrieve Streams
Call GET /fabric/v4/streams/{streamId} to get your Stream details.
Sample Curl Request
curl -X 'GET' \
   'https://api.equinix.com/fabric/v4/streams/657400f8-d360-11e9-bb65-2a2ae2dbcce5' \
-H 'accept: application/json' \
-H 'Authorization: Bearer <Bearer Token>’
Response
{
    "uuid": "241372e9-79c9-4ef8-b77a-8b8176c2098b4",
    "href": "https://api.equinix.com/fabric/v4/streams/241372e9-79c9-4ef8-b77a-    8b8176c228b4",
    "type": "STREAM_SUSBSCRIPTION",
    "name": "splunk1",
    "description": "subscription 1",
    "project": {
        "projectId": "300014703"
    },
    "enabled": true,
    "state": "PROVISIONED",
    "changelog": {
        "createdBy": "testuser",
        "createdDateTime": "2024-08-12T21:14:17.689104Z"
    }
}
Step 4: Delete Streams
Call DELETE /fabric/v4/streams/{streamId} to delete a Stream.
Sample Curl Request
curl -X 'DELETE' \
   'https://api.equinix.com/fabric/v4/streams/657400f8-d360-11e9-bb65-2a2ae2dbcce5' \
-H 'Content-Type: application/json' \
-H 'Authorization: Bearer <Bearer Token> '
How to Manage Subscription
Consumers can use the Subscription Management APIs to manage the delivery of telemetry data to their systems.
Before calling POST /fabric/v4/streams/{streamID}/subscriptions, refer to the Data Collector Section to set up a sink type of your choice
Note: The Subscription API URI/host values only support HTTPS and do not support self-signed certificates.
Refer to the payloads below to create a stream subscription for the supported data collectors:
Step 1: Create Subscription
Call POST /fabric/v4/streams/{streamId}/subscriptions to create a Subscription.
Sample Curl Request
curl -X 'POST' \
    'https://api.equinix.com/fabric/v4/streams/<streamId>/subscriptions' \
  --header 'Content-Type: application/json' \
  --header ' Authorization: Bearer <bearer_token>’ \
  -d
'{
     "type": "STREAM_SUBSCRIPTION",
     "name": "<servicenow_subscription_name>",
     "description": "<servicenow_subscription_desc>",
     "enabled": true,
     "sink": {
         "uri": "https://<host>.service-now.com",
         "type": "SERVICENOW",
         "settings": {
             "source": "<source_name>"}
         "credential": {
             "type": "USERNAME_PASSWORD",
             "username": "<servicenow-username>",
             "password": "<servicenow-password>"
         }
     }
}' curl -X 'POST' \
'https://api.equinix.com/fabric/v4/streams/<streamId>/subscriptions' \
--header 'Content-Type: application/json' \
--header ' Authorization: Bearer <bearer_token>’ \
-d
'{
"type": "STREAM_SUBSCRIPTION",
"name": "<splunk_subscription_name>",
"description": "<splunk_subscription_desc>",
"stream": {
"uuid": "<stream_id>" },
"sink": {
"uri": "<protocol>://http-inputs-<host>.splunkcloud.com:<port>/<endpoint>",
"type": "SPLUNK_HEC",
"settings": {
"eventIndex": "<name_of_eventIndex>",
"metricIndex": "<name_of_metricIndex>",
"source": "<name_of_splunk_hec>"},
"credential": {
"type": "ACCESS_TOKEN",
"accessToken": "Splunk <Splunk AccessToken>"
}
}
}' curl -X POST
'https://api.equinix.com/fabric/v4/streams/<streamId>/subscriptions' \
--header 'Content-Type: application/json' \
--header 'Authorization: Bearer <bearer_token>' \
--data '{
"type": "STREAM_SUBSCRIPTION",
"name": "<slack_subscription_name>",
"description": "<slack_subscription_desc>",
"stream": {
"uuid": "<stream_id>"
},
"sink": {
"uri": "<slack_webhook_uri>",
"type": "SLACK"
}
}
}'curl -X POST \
'https://api.equinix.com/fabric/v4/streams/<streamId>/subscriptions' \
--header 'Content-Type: application/json' \
--header 'Authorization: Bearer <bearer_token>' \
--data '{
"type": "STREAM_SUBSCRIPTION",
"name": "<pagerduty_subscription_name>",
"description": "<pagerduty_subscription_desc>",
"sink": {
"host": "https://events.pagerduty.com",
"type": "PAGERDUTY",
"credential": {
"type": "INTEGRATION_KEY",
"integrationKey": "<pagerduty_integration_key>"
}
}' curl -X POST \
'https://api.equinix.com/fabric/v4/streams/<streamId>/subscriptions' \
--header 'Content-Type: application/json' \
--header 'Authorization: Bearer <bearer_token>' \
--data '{
"type": "STREAM_SUBSCRIPTION",
"name": "<datadog_subscription_name>",
"description": "<datadog_subscription_desc>",
"sink": {
"host": "https://<datadog_host>.datadoghq.com",
"type": "DATADOG",
"credential": {
"type": "API_KEY",
"apiKey": "<datadog_api_key>"
},
"settings": {
"applicationKey": "<datadog_application_key>"
}
}
}' curl -X POST \
'https://api.equinix.com/fabric/v4/streams/<streamId>/subscriptions' \
--header 'Content-Type: application/json' \
--header 'Authorization: Bearer <bearer_token>’ \
-data '{
"type": "STREAM_SUBSCRIPTION",
"name": "<ms_teams_subscription>",
"description": "<ms_teams_subscription_desc>",
"sink": {
"uri": "<teams_webhook_uri>",
"type": "TEAMS",
}
}
}' Response
{
    "href": "https://api.equinix.com/fabric/v4/streams/241372e9-79c9-4ef8-b77a-8b8176c228b4/subscriptions/9b503760-b30f-4eb8-a681-aab1cfa9db1f",
    "uuid": "9b503760-b30f-4eb8-a681-aab1cfa9db1f",
    "type": "STREAM_SUBSCRIPTION",
    "name": "servnow_subscription",
    "description": "servnow_subscription_desc",
    "state": "PROVISIONING",
    "enabled": true,
    "sink": {
        "host": "https://<host>.service-now.com",
        "type": "SERVICENOW",
        "credential": {
            "type": "USERNAME_PASSWORD"
        },
        "batchEnabled": false,
        "batchSizeMax": 50,
        "batchWaitTimeMax": 5,
        "settings": {
            "source": "<source_name>",
            "metricUri": "https://<host>.service-now.com/api/mid/sa/metrics",
            "eventsUri": "https://<host>.service-now.com/api/global/em/jsonv2"
        }
    },
    "changeLog": {
        "createdBy": "user1",
        "createdDateTime": "2025-01-22T18:09:20.894582046Z"
    }
} {
"href": "https://api.equinix.com/fabric/v4/streams/241372e9-79c9-4ef8-b77a-8b8176c228b4/subscriptions/958a9854-dc49-4ded- 87bd-be4d0099355e", 4
"uuid": "958a9854-dc49-4ded-87bd-be4d0099355e",
"type": "STREAM_SUBSCRIPTION",
"name": " eq-splunk",
"description": "subscription1",
"state": "PROVISIONING",
"enabled": true,
"sink": {
"uri": "<protocol>://http-inputs-<host>.splunkcloud.com:<port>/<endpoint>",
"type": "SPLUNK_HEC",
"credential": {
"type": "ACCESS_TOKEN"
},
"batchEnabled": false,
"batchSizeMax": 50,
"batchWaitTimeMax": 5,
"settings": {
"eventIndex": "<name_of_eventIndex>",
"metricIndex": "<name_of_metricIndex>",
"source": "<name_of_splunk_hec>"
}
},
"changelog": {
"createdBy": "user1",
"createdDateTime": "2024-08-12T21:49:21.761029359Z"
}
} {
"href": "https://api.equinix.com/fabric/v4/streams/241372e9-79c9-4ef8-b77a-8b8176c228b4/subscriptions/12190e7d-a486-4a77-ba56-fecdab616837",
"uuid": "12190e7d-a486-4a77-ba56-fecdab616837",
"type": "STREAM_SUBSCRIPTION",
"name": "slack_subscription",
"description": "slack_subscription_desc",
"state": "PROVISIONED",
"enabled": true,
"sink": {
"uri": "****",
"type": "SLACK",
"batchEnabled": false,
"batchSizeMax": 50,
"batchWaitTimeMax": 5
},
"changelog": {
"createdBy": "user1",
"createdDateTime": "2024-10-04T13:20:40.127727Z"
}
} {
"href": "https://api.equinix.com/fabric/v4/streams/241372e9-79c9-4ef8-b77a-8b8176c228b4/dae0726a-87f0-4c5f-8662-ccbcf44a0de2",
"uuid": "dae0726a-87f0-4c5f-8662-ccbcf44a0de2",
"type": "STREAM_SUBSCRIPTION",
"name": "pagerduty-subscription",
"description": "pagerduty-subscription-desc",
"state": "PROVISIONED",
"enabled": true,
"sink": {
"host": "https://events.pagerduty.com",
"type": "PAGERDUTY",
"credential": {
"type": "INTEGRATION_KEY",
"integrationKey": "<encrypted_integration_key>"
},
"batchEnabled": false,
"batchSizeMax": 50,
"batchWaitTimeMax": 5,
"settings": {
"source": "equinix",
"changeUri": "https://events.pagerduty.com/v2/change/enqueue",
"alertUri": "https://events.pagerduty.com/v2/enqueue",
}
},
"changelog": {
"createdBy": "user1",
"createdDateTime": "2024-09-18T22:04:58.664523Z"
}
} {
"href": "https://api.equinix.com/fabric/v4/streams/241372e9-79c9-4ef8-b77a-8b8176c228b4/subscriptions/1a39648d-c407-4470-b08b-454965f31bf4",
"uuid": "1a39648d-c407-4470-b08b-454965f31bf4",
"type": "STREAM_SUBSCRIPTION",
"name": "datadog_subscription",
"description": "datadog_subscription_desc",
"state": "PROVISIONED",
"enabled": true,
"sink": {
"host": "https://<datadog_host>.datadoghq.com",
"type": "DATADOG",
"credential": {
"type": "API_KEY",
"apiKey": "<encrypted_datadog_api_key>"
},
"batchEnabled": false,
"batchSizeMax": 50,
"batchWaitTimeMax": 5,
"settings": {
"metricUri" : "https://<datadog_host>.datadoghq.com/api/v2/series",
"eventsUri" : "https://<datadog_host>.datadoghq.com/api/v1/events"
}
},
"changelog": {
"createdBy": "user1",
"createdDateTime": "2024-10-07T06:48:45.861755Z",
"updatedDateTime": "2024-10-07T06:48:51.514474Z"
}
} {
"href": "https://api.equinix.com/fabric/v4/streams/241372e9-79c9-4ef8-b77a-8b8176c228b4/subscriptions/12190e7d-a486-4a77-ba56-fecdab616837",
"uuid": "12190e7d-a486-4a77-ba56-fecdab616837",
"type": "STREAM_SUBSCRIPTION",
"name": "ms_teams_subscription",
"description": "ms_teams_subscription_desc",
"state": "PROVISIONED",
"enabled": true,
"sink": {
"uri": "*****",
"type": "TEAMS",
"batchEnabled": false,
"batchSizeMax": 50,
"batchWaitTimeMax": 5
},
"changelog": {
"createdBy": "user1",
"createdDateTime": "2024-10-04T13:20:40.127727Z"
}
} Step 2: Retrieve Subscription
Call GET /fabric/v4/streams/{streamId}/subscriptions/{subscriptionId} to get your Subscription details.
Sample Curl Request
curl -X 'GET'
'https://api.equinix.com/fabric/v4/streams/241372e9-79c9-4ef8-b77a-8b8176c228b4
/subscriptions/557400f8-d360-11e9-bb65-2a2ae2dbcce4' \
-H 'accept: application/json' \
-H 'Authorization: Bearer <Bearer Token>'
Response
{
    "href": "https://api.equinix.com/fabric/v4/streams/241372e9-79c9-4ef8-b77a-8b8176c228b4
/subscriptions/958a9854-dc49-4ded-87bd-be4d0099355e",
   "uuid": "958a9854-dc49-4ded-87bd-be4d0099355e",
    "type": "STREAM_SUBSCRIPTION",
    "name": " eq-splunk ",
    "description": "subscription1",
    "state": "PROVISIONED",
    "enabled": true,
    "sink": {
        "uri": "<protocol>://http-inputs-<host>.splunkcloud.com:<port>/<endpoint>",
        "type": "SPLUNK_HEC",
        "credential": {
            "type": "ACCESS_TOKEN"
        },
        "settings": {
            "eventIndex": "<name_of_eventIndex>",
            "metricIndex": "<name_of_metricIndex>",
            "source": "<name_of_splunk_hec>",
        }
    },
    "changelog": {
        "createdBy": "user1",
        "createdDateTime": "2024-08-12T21:49:21.761029Z"
    }
}
Step 3: Delete Subscription
Call DELETE /fabric/v4/streams/{streamId}/subscriptions/{subscriptionId} to delete a Subscription.
Sample Curl Request
curl -X 'DELETE' \
   'https://api.equinix.com/fabric/v4/streams/241372e9-79c9-4ef8-b77a-8b8176c228b4
/subscriptions/557400f8-d360-11e9-bb65-2a2ae2dbcce4' \
-H 'Content-Type: application/json' \
-H 'Authorization: Bearer <Bearer Token>'
Response
{
    "uuid": "958a9854-dc49-4ded-87bd-be4d0099355e",
    "href": "https://api.equinix.com/fabric/v4/streams/241372e9-79c9-4ef8-b77a-8b8176c228b4
/subscriptions/958a9854-dc49-4ded-87bd-be4d0099355e",
    "type": "STREAM_SUBSCRIPTION",
    "name": " eq-splunk ",
    "description": "subscription1",
    "state": "DEPROVISIONING",
    "enabled": true,
    "sink": {
        "uri": "<protocol>://http-inputs-<host>.splunkcloud.com:<port>/<endpoint>",
        "type": "SPLUNK_HEC",
        "credential": {
            "type": "ACCESS_TOKEN"
        },
        "settings": {
            "eventIndex": "<name_of_eventIndex>",
            "metricIndex": "<name_of_metricIndex>",
            "source": "<name_of_splunk_hec>",
        }
    },
    "changelog": {
        "createdBy": "user1",
        "createdDateTime": "2024-08-12T21:49:21.761029Z"
    }
}
How to Manage Assets
Asset Management APIs provide a seamless way to attach various types of Assets, such as Ports, Connections, Cloud Routers, Metros, Projects, and Organizations to a Stream. They ensure efficient organization and monitoring of your resources. You have the option to use existing Assets or create new ones to add to a Stream. There are available Assets:
-
Fabric Cloud Router (FCR) – To create a Fabric Cloud Router, Call POST /fabric/v4/routers
-
Connections – To create Connections, Call POST /fabric/v4/connections
-
Ports – To create Ports, Call POST /fabric/v4/ports
-
Metros – To view available metros, refer to Equinix Metros List.
-
Projects – To view all of your project's events, including events for each asset in your project, attach a project to your stream. Refer to the IAM docs.
-
Organizations –To view organization events, such as role assignments refer to the IAM docs.
Step 1: Attach Assets
Attach Assets to a Stream by calling PUT /fabric/v4/streams/{streamId}/{asset}/{assetId}
Note: To attach assets (Port, Connections, etc) onto a stream, the user needs to have at least the Viewer Role on that asset. To attach projects to a stream for lifecycle provisioning events, the user needs to have the Project Admin role. To attach organizations to a stream for role assignment, user login, and resource management events, the user needs to have the Org Admin role. To attach organizations to a stream for role assignment, the user needs to have the Org Admin role. Refer to the IAM documentation to get roles assigned to a user.
Sample Curl Request
curl -X 'PUT' \
   'https://api.equinix.com/fabric/v4/streams/<streamId>/ports/<portId>' \
-H 'accept: application/json' \
-H 'Content-Type: application/json' \
-H 'Authorization: Bearer <Bearer Token> ' \
-d
'{
    "metricsEnabled": true
}' curl -X 'PUT' \
'https://api.equinix.com/fabric/v4/streams/<streamId>/connections/<connectionId>' \
-H 'accept: application/json' \
-H 'Content-Type: application/json' \
-H 'Authorization: Bearer <Bearer Token> ' \
-d
'{
"metricsEnabled": true
}' curl -X 'PUT' \
'https://api.equinix.com/fabric/v4/streams/<streamId>/routers/<routerId>' \
-H 'accept: application/json' \
-H 'Content-Type: application/json' \
-H 'Authorization: Bearer <Bearer Token> ' \
-d
'{
"metricsEnabled": false
}'curl -X 'PUT' \
'https://api.equinix.com/fabric/v4/streams/<streamId>/metros/<metroCode>' \
-H 'accept: application/json' \
-H 'Content-Type: application/json' \
-H 'Authorization: Bearer <Bearer Token> ' \
-d
'{
"metricsEnabled": true
}' curl -X 'PUT' \
'https://api.equinix.com/fabric/v4/streams/<streamId>/projects/<projectId>' \
-H 'accept: application/json' \
-H 'Content-Type: application/json' \
-H 'Authorization: Bearer <Bearer Token> ' \
-d
'{
"includes": ["*"],
"metricsEnabled": true
}' curl -X 'PUT' \
'https://api.equinix.com/fabric/v4/streams/<streamId>/organizations/<organizationId>' \
-H 'accept: application/json' \
-H 'Content-Type: application/json' \
-H 'Authorization: Bearer <Bearer Token> ' \
-d
'{
"includes": ["*"],
"metricsEnabled": true
}' Response
{
     "href": "https://api.equinix.com/fabric/v4/streams/241372e9-79c9-4ef8-b77a-8b8176c2098b4/ports/dee885d7-a845-4873-8774-f83012e7a",
     "uuid": "dee885d7-a845-4873-8774-f83012e7a",
     "type": "XF_PORT",
     "metricsEnabled": true
     "attachmentStatus": "ATTACHING"
} {
"href": "https://api.equinix.com/fabric/v4/streams/241372e9-79c9-4ef8-b77a-8b8176c2098b4/connections/dee885d7-a845-4873-8774-f83012e7a",
"uuid": " dee885d7-a845-4873-8774-f83012e7a ",
"type": "IP_VC",
"metricsEnabled": true
"attachmentStatus": "ATTACHING"
} {
"href": "https://api.equinix.com/fabric/v4/streams/241372e9-79c9-4ef8-b77a-8b8176c2098b4/routers/dee885d7-a845-4873-8774-f83012e7a",
"uuid": " dee885d7-a845-4873-8774-f83012e7a ",
"type": "XF_ROUTER",
"metricsEnabled": false
"attachmentStatus": "ATTACHED"
} {
"href": "https://api.equinix.com/fabric/v4/streams/241372e9-79c9-4ef8-b77a-8b8176c2098b4/metros/SV",
"uuid": "SV",
"type": "XF_METRO",
"metricsEnabled": true
"attachmentStatus": "ATTACHED"
} {
"href": "https://api.equinix.com/fabric/v4/streams/241372e9-79c9-4ef8-b77a-8b8176c2098b4/projects/dee885d7-a845-4873-8774-f83012e7a",
"uuid": "dee885d7-a845-4873-8774-f83012e7a",
"type": "PROJECT",
"metricsEnabled": true
"attachmentStatus": "ATTACHED"
} {
"href": "https://api.equinix.com/fabric/v4/streams/241372e9-79c9-4ef8-b77a-8b8176c2098b4/organizations/dee885d7-a845-4873-8774-f83012e7a",
"uuid": "dee885d7-a845-4873-8774-f83012e7a",
"type": "ORGANIZATION",
"metricsEnabled": true
"attachmentStatus": "ATTACHED"
} Step 2: Retrieve Asset Details
Call GET /fabric/v4/streams/{streamId}/{asset}/{assetId} to get Asset details.
Sample Curl Request
curl -X 'GET' \
   'https://api.equinix.com/fabric/v4/streams/657400f8-d360-11e9-bb65-2a2ae2dbcce5/ports/757400f8-d360-11e9-bb65-2a2ae2dbcce6' \
-H 'accept: application/json' \
-H 'Authorization: Bearer <Bearer Token>'
Response
{
      "href": "https://api.equinix.com/fabric/v4/stream/241372e9-79c9-4ef8-b77a-8b8176c2098b4/ports/757400f8-d360-11e9-bb65-2a2ae2dbcce6",
       "uuid": " dee885d7-a845-4873-8774-f83012e7a ",
      "type": "XF_PORT",
      "metricsEnabled": true,
      "attachmentStatus": "ATTACHED"
}
Step 3: Delete Asset Attachment
Call DELETE /fabric/v4/streams/{streamId}/{asset}/{assetId} to delete Asset Attachment.
Sample Curl Request
curl -X 'DELETE' \
   'https://api.equinix.com/fabric/v4/streams/657400f8-d360-11e9-bb65-2a2ae2dbcce5/ports/757400f8-d360-11e9-bb65-2a2ae2dbcce6' \
-H 'Content-Type: application/json' \
-H 'Authorization: Bearer <Bearer Token>'
Response
{
      "href": "https://api.equinix.com/fabric/v4/stream/241372e9-79c9-4ef8-b77a-8b8176c2098b4/ports/757400f8-d360-11e9-bb65-2a2ae2dbcce6",
      "uuid": " dee885d7-a845-4873-8774-f83012e7a ",
      "type": "XF_PORT",
       "metricsEnabled": true,
      "attachmentStatus": "DETACHING"
}
How to Manage Metric Alert Rules
The Stream Alert Rule Management APIs offer a method to send an alert event to a Sink Type when a metric crosses a defined threshold value. The Metric Alert Rule can define both a warningThreshold and a criticalThreshold, which will trigger a metric alert event if the metric value falls below or exceeds the expected threshold.
To view the list of supported metrics, refer to the API Reference and Related Resources Section.
Step 1: Create Metric Alert Rule
Call GET /fabric/v4/streams/{streamId}/alertRules to create a Metric Alert Rule.
Sample Curl Request
curl --location 'https://api.equinix.com/fabric/v4/streams/<streamId>/alertRules' \
--header 'Content-Type: application/json' \
--header 'Authorization: Bearer <bearer_token> \
--data '{
    "type": "METRIC_ALERT",
    "name": "<alert_rule_name>",
    "description": "<alert_rule_desc>",
    "enabled": "true",
    "metricName": "equinix.fabric.port.bandwidth_tx.usage",
    "resourceSelector": {
        "include": [
            "*/ports/<uuid>"
        ]
    },
    "operand": "ABOVE",
    "windowSize": "PT15M",
    "warningThreshold": "10000000",
    "criticalThreshold": "15000000"
}'
Response
{
    "href": "https://api.equinix.com/fabric/v4/streams/128cfe7c-e24f-4b1b-8a4f-680cd650c46c/alertRules/28da40d8-09bf-49f2-a02d-af34210f275e",
    "uuid": "28da40d8-09bf-49f2-a02d-af34210f275e",
    "type": "METRIC_ALERT",
    "name": "<alert_rule_name>",
    "description": "<alert_rule_name>",
    "state": "ACTIVE",
    "enabled": true,
    "metricName": "equinix.fabric.port.bandwidth_tx.usage",
    "resourceSelector": {
        "include": [
            "*/ports/<uuid>"
        ]
    },
    "windowSize": "PT15M",
    "operand": "ABOVE",
    "warningThreshold": "43000000",
    "criticalThreshold": "45000000",
    "changeLog": {
        "createdBy": "testuser",
        "createdDateTime": "2025-02-04T23:17:54.323427936Z"
    }
}
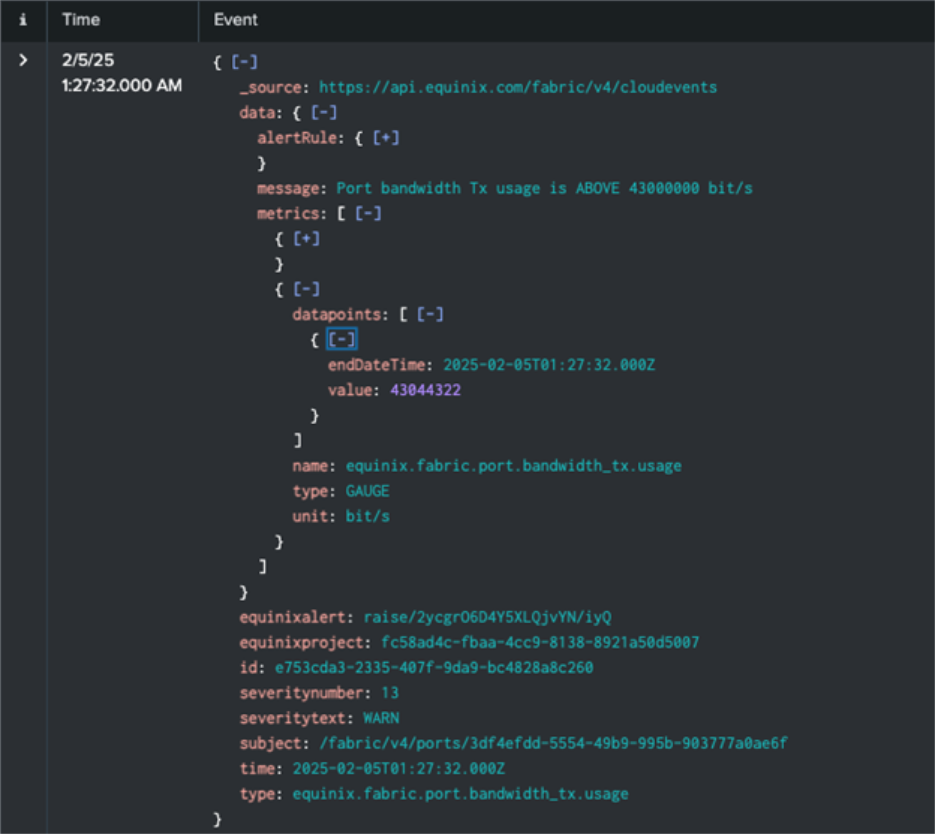
Once you create a Metric Alert Rule, you will receive an event when the threshold value is crossed. For the example below, an alert event was raised when the Port Bandwidth Transmitted (tx) Rate exceeded the warning threshold. An additional alert event would have been raised if the Port Bandwidth Transmitted (tx) Rate exceeded the critical warning. Once the transmitted rate falls below the warning threshold, a clear metric alert event would be generated.
Step 2: Retrieve Metric Alert Rule
Call GET /fabric/v4/streams/{streamId}/alertRules/{alertRuleId} to get your Metric Alert Rule details.
Sample Curl Request
curl --location 'https://api.equinix.com/fabric/v4/streams/<streamId>/alertRules/<alertRuleId>' \
--header 'Content-Type: application/json' \
--header 'Authorization: Bearer <bearer_token>'
Response
{
    "href": "https://api.equinix.com/fabric/v4/streams/128cfe7c-e24f-4b1b-8a4f-680cd650c46c/alertRules/28da40d8-09bf-49f2-a02d-af34210f275e",
    "uuid": "28da40d8-09bf-49f2-a02d-af34210f275e",
    "type": "METRIC_ALERT",
    "name": "<alert_rule_name>",
    "description": "<alert_rule_name>",
    "state": "ACTIVE",
    "enabled": true,
    "metricName": "equinix.fabric.port.bandwidth_tx.usage",
    "resourceSelector": {
        "include": [
            "*/ports/<uuid>"
        ]
    },
    "windowSize": "PT15M",
    "operand": "ABOVE",
    "warningThreshold": "43000000",
    "criticalThreshold": "45000000",
    "changeLog": {
        "createdBy": "testuser",
        "createdDateTime": "2025-02-04T23:17:54.323427936Z"
    }
}
Step 3: Delete Metric Alert Rule
Call DELETE /fabric/v4/streams/{streamId}/alertRules/{alertRuleId} to delete a Metric Alert Rule.
Sample Curl Request
curl --location --request DELETE 'https://api.equinix.com/fabric/v4/streams/<streamId>/alertRules/<alertRuleId>' \
--header 'Content-Type: application/json' \
--header 'Authorization: Bearer <bearer_token>'
Response
{
    "href": "https://api.equinix.com/fabric/v4/streams/128cfe7c-e24f-4b1b-8a4f-680cd650c46c/alertRules/28da40d8-09bf-49f2-a02d-af34210f275e",
    "uuid": "28da40d8-09bf-49f2-a02d-af34210f275e",
    "type": "METRIC_ALERT",
    "name": "<alert_rule_name>",
    "description": "<alert_rule_name>",
    "state": "INACTIVE",
    "enabled": true,
    "metricName": "equinix.fabric.port.bandwidth_tx.usage",
    "resourceSelector": {
        "include": [
            "*/ports/<uuid>"
        ]
    },
    "windowSize": "PT15M",
    "operand": "ABOVE",
    "warningThreshold": "43000000",
    "criticalThreshold": "45000000",
    "changeLog": {
        "createdBy": "testuser",
        "createdDateTime": "2025-02-04T23:17:54.323427936Z"
    }
}
Receive Events in Client Sink Integration
You can generate events in different ways.
-
BGP State Events - When configuring BGP and performing actions such as disable, enable, or reset on the portal, BGP events related to FCR connections will be generated. These events include BGP IPV4/IPv6 Idle, Connected, or Established states.
-
Route Quota Usage Events - FCR and FCR related connections can learn IPV4/IPv6 routes up to 90% or 100% of the FCR Package Type. These routes are typically learned based on the IPV4/IPv6 addresses configured in BGP.
-
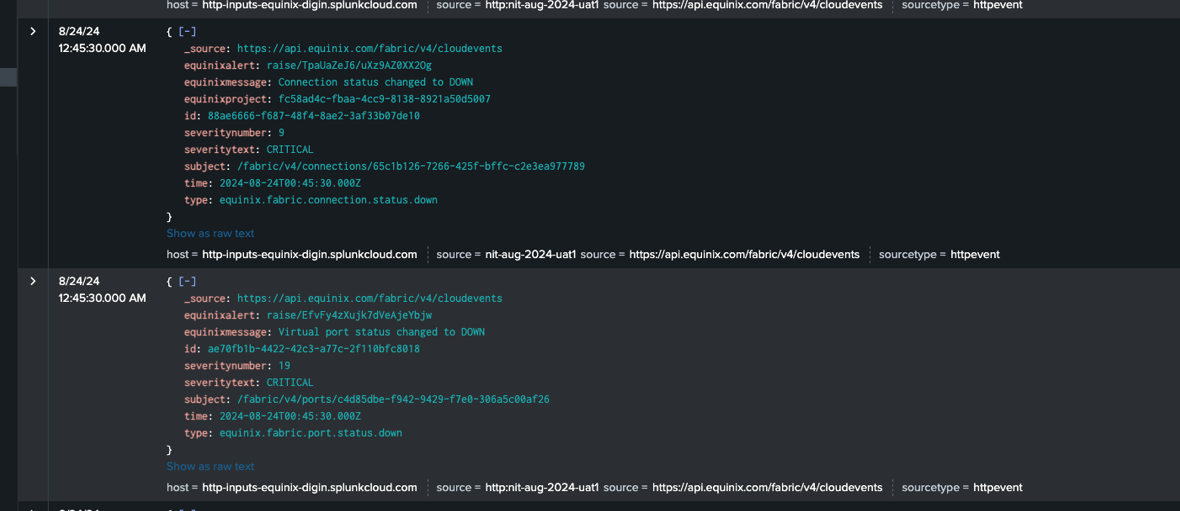
Port and Connection Up/Down Events - These events are critical to the user. If an Equinix Port goes down, a Port and Connection Down Event will be triggered. Once the Equinix Port recovers, a Port and Connection Up Event will be sent.
-
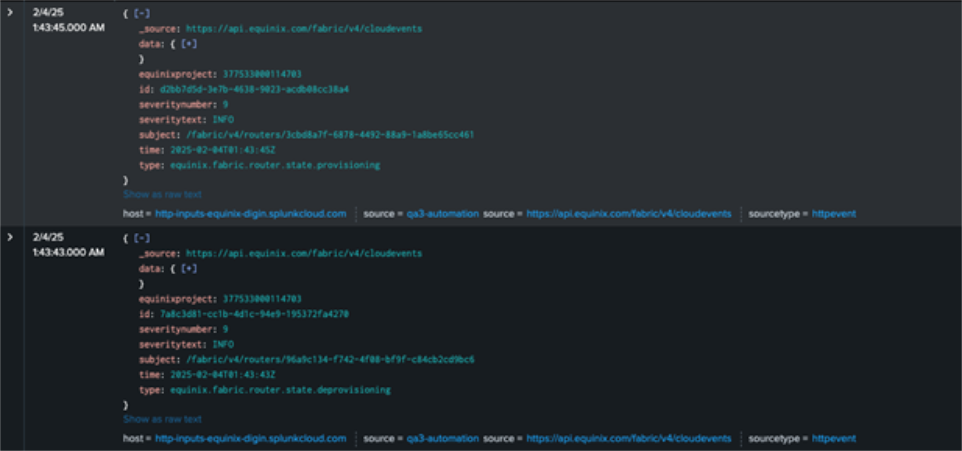
Fabric and Network Edge Asset Lifecycle Provisioning Events – Track the service provisioning of your assets, such as ports, connections, FCRs, Virtual Devices, etc. Any status change to your asset, including provisioning, deprovisioning, and failures, will result in an event being sent.
-
Organization Events - These events are from access manager and resource manager to inform organization administrators of the change events happening within the organization such as adding or removing roles for users.
Once you create a subscription, you will receive Events whenever they occur.
For example, if you attached a project to your stream you can view asset lifecycle events whenever you create or delete an asset.
-
Log in to Fabric Portal.
-
Navigate to create a Port, Connection, Service Token, Network, etc.
 Copy
Copy{ [-]
_source: https://api.equinix.com/fabric/v4/cloudevents
data: { [-]
message: Router named router-name state changed to provisioning
resource:[+]
}
}
equinixproject: 377533000114703
id: d2bb7d5d-3e7b-4638-9023-acdb08cc38a4
severitynumber: 9
severitytext: INFO
subject: /fabric/v4/routers/3cbd8a7f-6878-4492-88a9-1a8be65cc461
time: 2025-02-04T01:43:45Z
type: equinix.fabric.router.state.provisioning
Show as raw text
host = http-inputs-<host>.splunkcloud.com
source = Equinix
source = https://api.equinix.com/fabric/v4/cloudevents
For your FCR to Port Connection, set up Direct and BGP routing protocol and enable or disable BGP:
-
Log in to Fabric Portal.
-
Navigate to Connection Inventory.
-
Open Connection Asset that is attached to Streams.
-
Navigate to the Routing Protocol tab.
-
Enable or Disable BGP Ipv4/Ipv6 Routing Protocol.
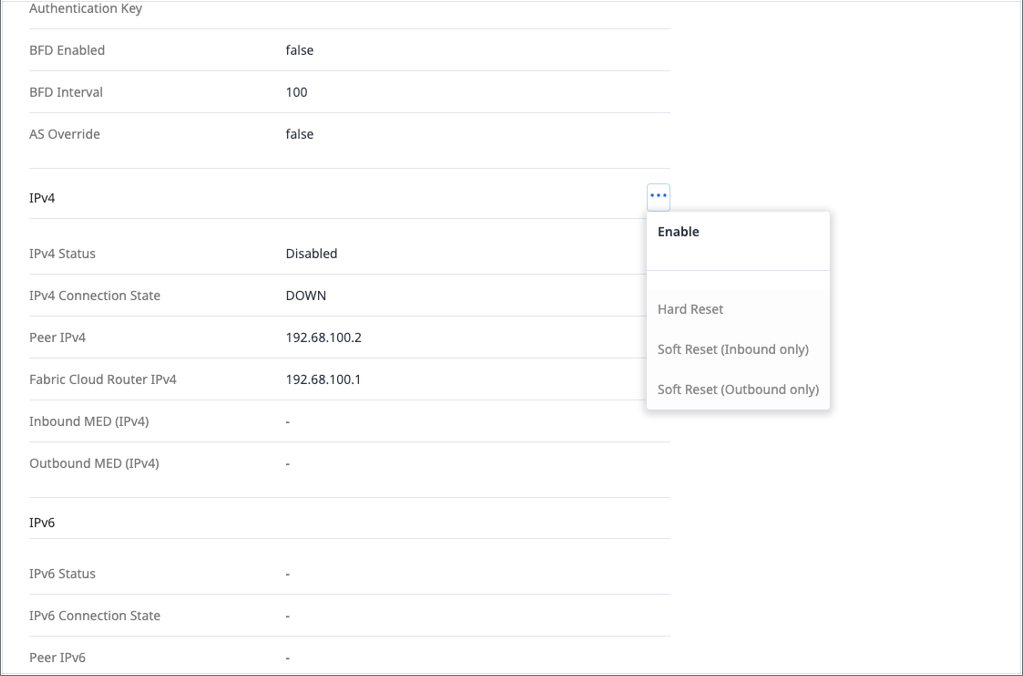
-
Splunk will receive an Event.
Once your subscriptions are active, go to Splunk and search using index="<name_of_splunk_hec>". This search should return the relevant Event data collected by Splunk.
{ [-]
   _source: https://api.equinix.com/fabric/v4/cloudevents
   equinixmessage: Virtual port status changed to UP
   id: 5345e011-4478-484b-beb4-38c940ff2f9e
   severitynumber: 9
   severitytext: INFO
   subject: /fabric/v4/ports/c4d85dbe-f965-9659-f7e0-306a5c00af26
   time: 2024-07-26T12:31:53.975Z
   type: equinix.fabric.port.status.up
}
Show as raw text
host = http-inputs-equinix-digin.splunkcloud.com
source = Equinix
sourcetype = _json
Receive Metrics in Client Sink Integration
Once you subscribe to the asset(s) metrics, you will receive metrics at a 5-minute interval:
-
Port and Connection Bandwidth Usage Metrics provide a bit per second (bit/s) output for the data transmitted (tx) or received (rx) in the port or connection asset.
-
Metro Latency Metrics provide the latency in milliseconds (ms) from a single subscribed metro code to other metros supported by Equinix.
-
Port Error and Dropped Metrics provide the number of packet discards on a given port due to packet format, transmission errors, or even when the port doesn’t have bandwidth to accept the packet.
-
Connection Packet Dropped Metrics provide the number of packets dropped on a connection due to exceeding bandwidth limits for both transmitted (tx) or received (rx) data.
API Reference and Related Resources
For more details on Observability APIs, refer to the resources below.
Refer to Fabric Support for any inquiries.
