指标
监控特定指标数据,以近乎实时的方式衡量资产的性能。流式网络数据包括以下指标:
-
端口带宽使用指标为端口传输(TX)或接收(Rx)的数据提供每秒比特(bit/s)输出。
-
连接带宽使用为端口为A侧的连接,云路由器与端口之间以及云路由器与云服务提供商之间传输(TX)或接收(Rx)的数据提供每秒比特(bit/s)输出。
-
城域网延迟指标提供从单个订阅城域网代码到其他城域网的延迟(以毫秒(ms)为单位)以及所有城域网对之间的延迟。
-
端口错误和丢弃指标提供给定端口上由于数据包格式,传输错误或即使端口没有接受数据包的带宽时丢弃的数据包数量。
-
连接数据包丢弃指标提供了由于传输(TX)或接收(Rx)数据的带宽限制超出连接上丢弃的数据包数量。仅在连接的端口端可用。
请参阅每个资产支持的指标参考。
查看指标
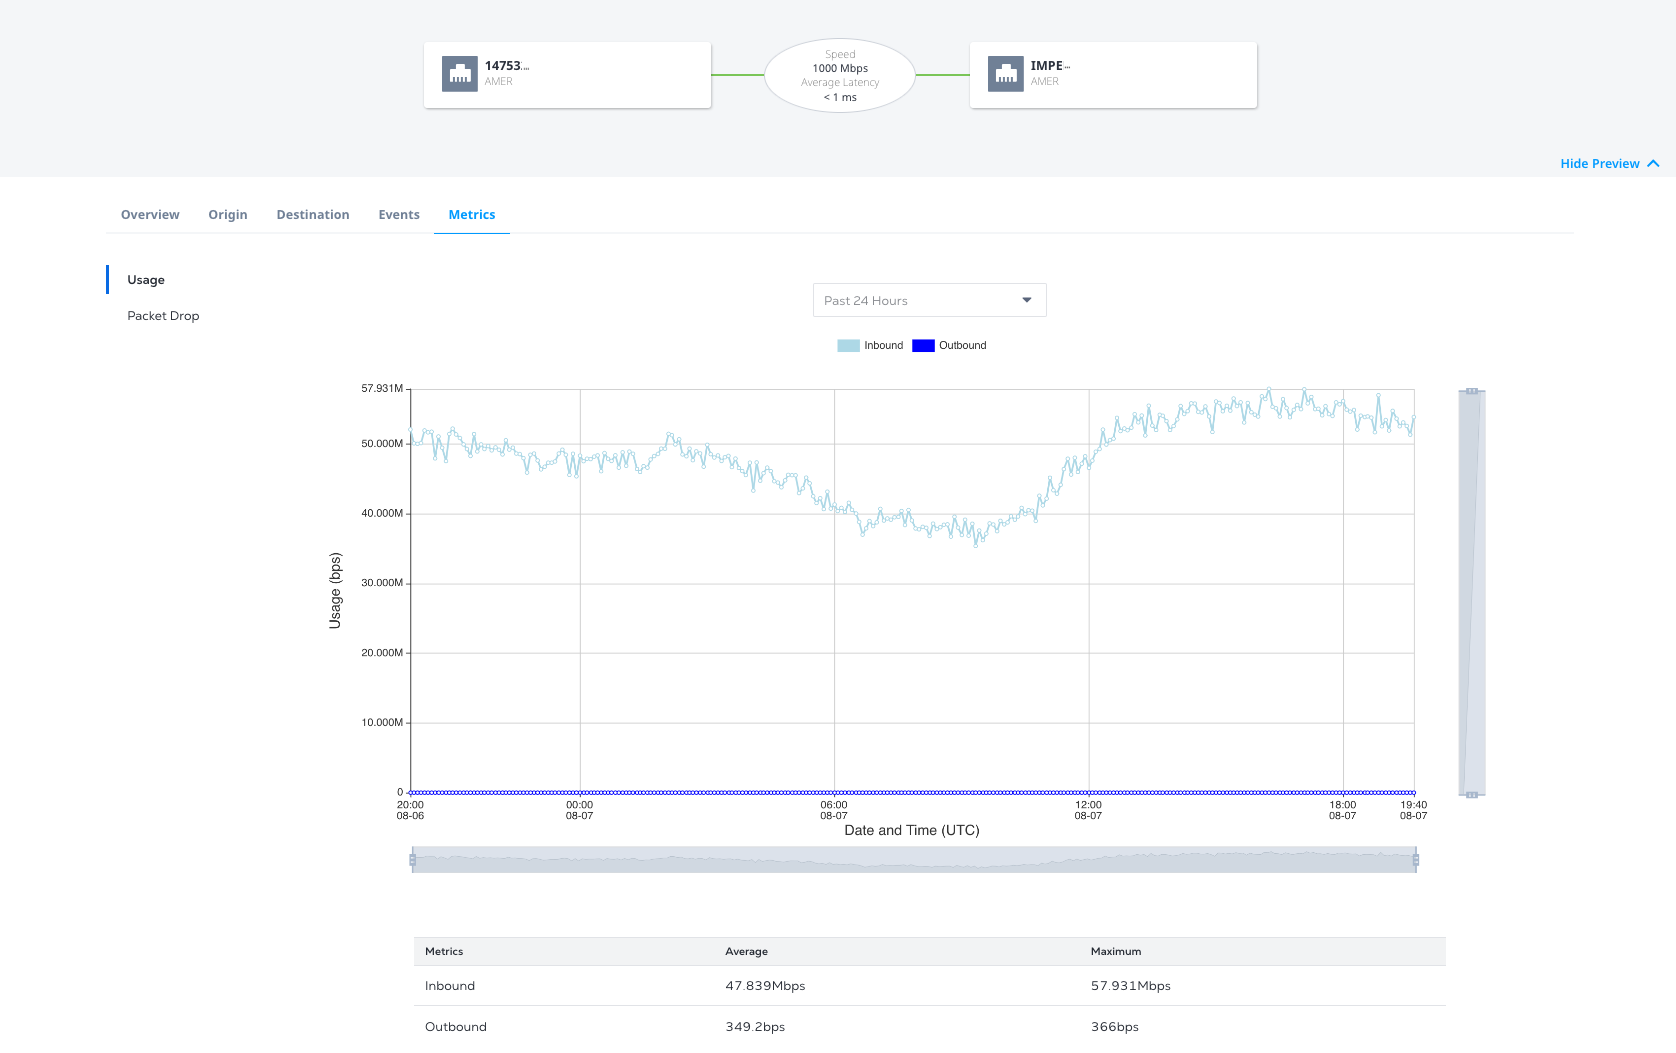
您可以在客户门户中查看单个端口或虚拟连接的指标。提供使用和数据包丢弃指标。
-
登录客户门户> Fabric Dashboard。
-
导航至_Port Inventory_或_Connections Inventory_。
-
选择端口或虚拟连接。
从API查看指标
您可以从Equinix API检索单个资产的指标。为了使事件数据在API中可用, 您必须先创建一个流并将资产附加到该流。
城域间延迟
要查看两个城域网之间的延迟,请向/Fabric/v4/Mobile/Mobile/Mobile/Mobile/Metrics <asset>端点发送get请求<asset_id>,其中:
asset是metrosasset_id是双字母Metro代码- 并将
name=equinix.fabric.metro.METRO_LATENCY.LATENCY <origin_metro_code>指定<destination_metro_code>为请求的查询参数。
卷曲请求示例:
curl -X 'GET' 'https://api.equinix.com/fabric/v4/metros/SV/metrics?name=equinix.fabric.metro.sv_am.latency' \
-H 'Content-Type: application/json' \
-H 'Authorization: Bearer <Bearer Token>'
示例响应:
{
    "pagination": {
        "offset": 0,
        "limit": 10,
        "total": 3,
        "next": null,
        "previous": null
    },
    "data": [
        {
            "type": "GAUGE",
            "name": "equinix.fabric.metro.sv_am.latency",
            "unit": "ms",
            "resource": {
                "href": "https://uatapi.equinix.com/fabric/v4/metros/SV",
                "type": "XF_METRO",
                "description": "Silicon Valley to Amsterdam intermetro latency, average in milliseconds"
            },
            "summary": {
                "mean": 136.9,
                "max": 137
            },
            "datapoints": [
                {
                    "endDateTime": "2025-06-05T18:50:03Z",
                    "value": 137
                },
                {
                    "endDateTime": "2025-06-05T18:55:03Z",
                    "value": 137
                },
                {
                    "endDateTime": "2025-06-05T19:00:03Z",
                    "value": 137
                },
                {
                    "endDateTime": "2025-06-05T19:05:03Z",
                    "value": 137
                }
            ]
        }
    ]
}
要查看所有城域网对之间的实时延迟,请向/Fabric/v4/metrics端点发送get请求。在查询参数中,指定:
name=Equinix.fabric.metro.*.latency和value=last。- (可选)包含参数
<limit>,以指定要从结果返回的所需度量类型数。 - (可选)包括参数
<offset>以指定要跳过的结果数。
卷曲请求示例:
curl -X 'GET' 'https://api.equinix.com/fabric/v4/metrics?value=last&limit=3&name=equinix.fabric.metro.*.latency' \
-H 'Content-Type: application/json' \
-H 'Authorization: Bearer <Bearer Token>'
示例响应:
{
  "pagination": {
    "offset": 0,
    "limit": 3,
    "total": 4112,
    "next": "/metrics?offset=3&limit=3&fromDateTime=2026-01-29T18:05:44.041Z&name=equinix.fabric.metro.*.latency&toDateTime=2026-01-30T18:05:44.041Z"
  },
  "data": [
    {
      "type": "GAUGE",
      "name": "equinix.fabric.metro.am_at.latency",
      "unit": "ms",
      "resource": {
        "href": "https://api.equinix.com/fabric/v4/metros/AM",
        "type": "XF_METRO",
        "code": "AM",
        "description": "Amsterdam to Atlanta intermetro latency, average in milliseconds"
      },
      "datapoints": [
        {
          "endDateTime": "2026-01-30T18:05:00Z",
          "value": 94.7
        }
      ]
    },
    {
      "type": "GAUGE",
      "name": "equinix.fabric.metro.am_ba.latency",
      "unit": "ms",
      "resource": {
        "href": "https://api.equinix.com/fabric/v4/metros/AM",
        "type": "XF_METRO",
        "code": "AM",
        "description": "Amsterdam to Barcelona intermetro latency, average in milliseconds"
      },
      "datapoints": [
        {
          "endDateTime": "2026-01-30T18:05:00Z",
          "value": 28.8
        }
      ]
    },
    {
      "type": "GAUGE",
      "name": "equinix.fabric.metro.am_bg.latency",
      "unit": "ms",
      "resource": {
        "href": "https://api.equinix.com/fabric/v4/metros/AM",
        "type": "XF_METRO",
        "code": "AM",
        "description": "Amsterdam to Bogota intermetro latency, average in milliseconds"
      },
      "datapoints": [
        {
          "endDateTime": "2026-01-30T18:05:00Z",
          "value": 159
        }
      ]
    }
  ]
}
端口带宽使用情况
要查看端口的带宽使用情况,请将get请求发送到/Fabric/v4/Mobile/Mobile/Metrics <asset>端点,其中<asset_id>:
asset是portsasset_id是特定端口的uuid
查询参数:
- 入站-
equinix.fabric.port.bandwidth_rx.usage - 出站-
equinix.fabric.port.bandwidth_tx.usage
要查看所有带宽使用情况,请指定name=equinix.fabric.port.bandwidth_rx.usage&name=equinix.fabric.port.bandwidth_tx.usage作为请求的查询参数。使用fromDateTime和toDateTime指定时间段。
卷曲请求示例:
curl -X 'GET' 'https://api.equinix.com/fabric/v4/ports/<port_id>/metrics?name=equinix.fabric.port.bandwidth_rx.usage&name=equinix.fabric.port.bandwidth_tx.usage&fromDateTime=2025-05-12T19%3A18%3A00Z&toDateTime=2025-05-13T19%3A18%3A00Z' \
-H 'Content-Type: application/json' \
-H 'Authorization: Bearer <Bearer Token>'
示例响应:
{
    "pagination": {
        "offset": 0,
        "limit": 10,
        "total": 2,
        "next": null,
        "previous": null
    },
    "data": [
        {
            "type": "GAUGE",
            "name": "equinix.fabric.port.bandwidth_rx.usage",
            "unit": "bit/s",
            "resource": {
                "href": "https://api.equinix.com/fabric/v4/ports/<portId>",
                "type": "XF_PORT",
                "uuid": "<portId>",
                "state": "PROVISIONED",
                "name": "TEST-PORT-NAME"
            },
            "summary": {
                "mean": 198.7,
                "max": 219
            },
            "datapoints": [
                {
                    "endDateTime": "2025-05-12T19:20:47.000Z",
                    "value": 202
                },
                {
                    "endDateTime": "2025-05-12T19:25:51.000Z",
                    "value": 192
                },
                {
                    "endDateTime": "2025-05-12T19:30:51.000Z",
                    "value": 203
                },
                {
                    "endDateTime": "2025-05-12T19:35:53.000Z",
                    "value": 194
                }
            ]
        },
        {
            "type": "GAUGE",
            "name": "equinix.fabric.port.bandwidth_tx.usage",
            "unit": "bit/s",
            "resource": {
                "href": "https://api.equinix.com/fabric/v4/ports/<portId>",
                "type": "XF_PORT",
                "uuid": "<portId>",
                "state": "PROVISIONED",
                "name": "TEST-PORT-NAME"
            },
            "summary": {
                "mean": 0,
                "max": 0
            },
            "datapoints": [
                {
                    "endDateTime": "2025-05-12T19:20:47.000Z",
                    "value": 0
                },
                {
                    "endDateTime": "2025-05-12T19:25:51.000Z",
                    "value": 0
                },
                {
                    "endDateTime": "2025-05-12T19:30:51.000Z",
                    "value": 0
                },
                {
                    "endDateTime": "2025-05-12T19:35:53.000Z",
                    "value": 0
                }
            ]
        }
    ]
}
端口数据包丢弃
要查看从端口丢弃的数据包计数,请将get请求发送到/Fabric/v4/Mobile/Mobile/Metrics <asset>端点,其中<asset_id>:
asset是portsasset_id是特定端口的uuid
查询参数:
- 入站-
Equinix.fabric.port.packets_dropted_rx.count - 出站-
Equinix.fabric.port.packets_droppd_tx.count
要获得所有丢弃数据包的计数,请将name=Equinix.fabric.port.packets_dropd_rx.count&name=Equinix.fabric.port.packets_dropd_tx.count指定为请求的查询参数。使用fromDateTime和toDateTime指定时间段。
卷曲请求示例:
curl -X 'GET' 'https://api.equinix.com/fabric/v4/ports/<portId>/metrics?name=equinix.fabric.port.packets_dropped_rx.count&name=equinix.fabric.port.packets_dropped_tx.count&fromDateTime=2025-05-12T19%3A18%3A00Z&toDateTime=2025-05-13T19%3A18%3A00Z' \
-H 'Content-Type: application/json' \
-H 'Authorization: Bearer <Bearer Token>'
示例响应:
{
    "pagination": {
        "offset": 0,
        "limit": 10,
        "total": 2,
        "next": null,
        "previous": null
    },
    "data": [
        {
            "type": "SUM",
            "name": "equinix.fabric.port.packets_dropped_rx.count",
            "unit": "packet",
            "resource": {
                "href": "https://api.equinix.com/fabric/v4/ports/<portId>",
                "type": "XF_PORT",
                "uuid": "<portId>",
                "state": "PROVISIONED",
                "name": "TEST-PORT-NAME"
            },
            "summary": {
                "mean": 0,
                "max": 0
            }
        },
        {
            "type": "SUM",
            "name": "equinix.fabric.port.packets_dropped_tx.count",
            "unit": "packet",
            "resource": {
                "href": "https://api.equinix.com/fabric/v4/ports/<portId>",
                "type": "XF_PORT",
                "uuid": "<portId>",
                "state": "PROVISIONED",
                "name": "TEST-PORT-NAME"
            },
            "summary": {
                "mean": 0,
                "max": 0
            }
        }
    ]
}
端口数据包错误
要查看端口的数据包错误,请将get请求发送到/Fabric/v4/Mobile/Mobile/Metrics <asset>端点<asset_id>
asset是portsasset_id是特定端口的uuid
查询参数:
- 入站-
Equinix.fabric.port.packets_erred_rx.count - 出站-
Equinix.fabric.port.packets_erred_tx.count
要获得所有数据包错误的计数,请将name=Equinix.fabric.port.packets_erred_rx.count&name=Equinix.fabric.port.pacets_erred_tx.count指定为请求的查询参数。使用fromDateTime和toDateTime指定时间段。
卷曲请求示例:
curl -X 'GET' 'https://api.equinix.com/fabric/v4/ports/<portId>/metrics?name=equinix.fabric.port.packets_erred_rx.count&name=equinix.fabric.port.packets_erred_tx.count&fromDateTime=2025-05-12T19%3A18%3A00Z&toDateTime=2025-05-13T19%3A18%3A00Z' \
-H 'Content-Type: application/json' \
-H 'Authorization: Bearer <Bearer Token>'
示例响应:
{
    "pagination": {
        "offset": 0,
        "limit": 10,
        "total": 2,
        "next": null,
        "previous": null
    },
    "data": [
        {
            "type": "SUM",
            "name": "equinix.fabric.port.packets_erred_rx.count",
            "unit": "packet",
            "resource": {
                "href": "https://api.equinix.com/fabric/v4/ports/<portId>",
                "type": "XF_PORT",
                "uuid": "<portId>",
                "state": "PROVISIONED",
                "name": "TEST-PORT-NAME"
            },
            "summary": {
                "mean": 0,
                "max": 0
            }
        },
        {
            "type": "SUM",
            "name": "equinix.fabric.port.packets_erred_tx.count",
            "unit": "packet",
            "resource": {
                "href": "https://api.equinix.com/fabric/v4/ports/<portId>",
                "type": "XF_PORT",
                "uuid": "<portId>",
                "state": "PROVISIONED",
                "name": "TEST-PORT-NAME"
            },
            "summary": {
                "mean": 0,
                "max": 0
            }
        }
    ]
}
连接带宽使用情况
要查看连接的带宽使用情况,请将get请求发送到/Fabric/v4/Mobile/Mobile/Metrics <asset>端点,其中<asset_id>:
assetisconnectionsasset_id是特定连接的uuid
查询参数:
- 入站-
equinix.fabric.connection.bandwidth_rx.usage - 出站-
equinix.fabric.connection.bandwidth_tx.usage
要查看所有带宽使用情况,请指定name=equinix.fabric.connection.bandwidth_rx.usage&name=equinix.fabric.connection.bandwidth_tx.usage作为请求的查询参数。使用fromDateTime和toDateTime指定时间段。
卷曲请求示例:
curl -X 'GET' 'https://api.equinix.com/fabric/v4/connections/<connectionId>/metrics?name=equinix.fabric.connection.bandwidth_rx.usage&name=equinix.fabric.connection.bandwidth_tx.usage&fromDateTime=2025-05-12T19%3A18%3A00Z&toDateTime=2025-05-13T19%3A18%3A00Z' \
-H 'Content-Type: application/json' \
-H 'Authorization: Bearer <Bearer Token>'
示例响应:
{
    "pagination": {
        "offset": 0,
        "limit": 10,
        "total": 2,
        "next": null,
        "previous": null
    },
    "data": [
        {
            "type": "GAUGE",
            "name": "equinix.fabric.connection.bandwidth_rx.usage",
            "unit": "bit/s",
            "resource": {
                "href": "https://api.equinix.com/fabric/v4/connections/<connectionId>",
                "type": "EVPL_VC",
                "uuid": "<connectionId>",
                "state": "PROVISIONED",
                "name": "TEST-CONNECTION-NAME"
            },
            "summary": {
                "mean": 0,
                "max": 0
            },
            "datapoints": [
                {
                    "endDateTime": "2025-05-12T19:22:48.000Z",
                    "value": 202
                },
                {
                    "endDateTime": "2025-05-12T19:27:50.000Z",
                    "value": 192
                },
                {
                    "endDateTime": "2025-05-12T19:31:51.000Z",
                    "value": 203
                },
                {
                    "endDateTime": "2025-05-12T19:37:45.000Z",
                    "value": 194
                }
            ]
        },
        {
            "type": "GAUGE",
            "name": "equinix.fabric.connection.bandwidth_tx.usage",
            "unit": "bit/s",
            "resource": {
                "href": "https://api.equinix.com/fabric/v4/connections/<connectionId>",
                "type": "EVPL_VC",
                "uuid": "<connectionId>",
                "state": "PROVISIONED",
                "name": "TEST-CONNECTION-NAME"
            },
            "summary": {
                "mean": 0,
                "max": 0
            },
            "datapoints": [
                {
                    "endDateTime": "2025-05-12T19:22:48.000Z",
                    "value": 0
                },
                {
                    "endDateTime": "2025-05-12T19:27:50.000Z",
                    "value": 0
                },
                {
                    "endDateTime": "2025-05-12T19:31:51.000Z",
                    "value": 0
                },
                {
                    "endDateTime": "2025-05-12T19:37:45.000Z",
                    "value": 0
                }
            ]
        }
    ]
}
连接数据包丢弃
要查看从连接丢弃的数据包,请将get请求发送到/Fabric/v4/Mobile/Mobile/Metrics <asset>端点,其中<asset_id>:
assetisconnectionsasset_id是特定连接的uuid
指标适用于连接的A侧,Z侧,入站和出站。
查询参数:
- 入站A侧-
Equinix.fabric.connection.packets_dropted_rx_aside_rateeceed.count - 出站A侧-
Equinix.fabric.connection.packets_dropted_tx_aside_rateexced.count - 入站z侧-
Equinix.fabric.connection.packets_droppd_rx_zside_rateexced.count - 出站z-side -
Equinix.fabric.connection.packets_dropted_tx_zside_rateexced.count
要查看连接中所有丢弃的数据包,请指定name=Equinix.fabric.connection.packets_dropp_rx_aside_rateeceed.count&name=Equinix.fabric.connection.pacets_dropd_tx_aside_rateeceed.count=Equinix.fabric.connection.pacets_rx_zsideceed.count&name=equinix.fabric.使用fromDateTime和toDateTime指定时间段。
curl -X 'GET' 'https://api.equinix.com/fabric/v4/connections/<connectionId>/metrics?name=equinix.fabric.connection.packets_dropped_rx_aside_rateexceeded.count&name=equinix.fabric.connection.packets_dropped_tx_aside_rateexceeded.count&name=equinix.fabric.connection.packets_dropped_rx_zside_rateexceeded.count&name=equinix.fabric.connection.packets_dropped_tx_zside_rateexceeded.count&fromDateTime=2025-05-12T19%3A18%3A00Z&toDateTime=2025-05-13T19%3A18%3A00Z' \
-H 'Content-Type: application/json' \
-H 'Authorization: Bearer <Bearer Token>'
示例响应:
{
    "pagination": {
        "offset": 0,
        "limit": 10,
        "total": 2,
        "next": null,
        "previous": null
    },
    "data": [
        {
            "type": "SUM",
            "name": "equinix.fabric.connection.packets_dropped_rx_aside_rateexceeded.count",
            "unit": "packet",
            "resource": {
                "href": "https://api.equinix.com/fabric/v4/connections/<connectionId>",
                "type": "EVPL_VC",
                "uuid": "<connectionId>",
                "state": "PROVISIONED",
                "name": "TEST-CONNECTION-NAME"
            },
            "summary": {
                "mean": 0,
                "max": 0
            },
             "datapoints": [
                {
                    "endDateTime": "2025-05-12T19:28:59.000Z",
                    "value": 0
                },
                {
                    "endDateTime": "2025-05-12T19:34:01.000Z",
                    "value": 0
                },
                {
                    "endDateTime": "2025-05-12T19:36:16.000Z",
                    "value": 0
                },
                {
                    "endDateTime": "2025-05-12T19:42:12.000Z",
                    "value": 0
                }
            ]
        },
        {
            "type": "SUM",
            "name": "equinix.fabric.connection.packets_dropped_tx_aside_rateexceeded.count",
            "unit": "packet",
            "resource": {
                "href": "https://api.equinix.com/fabric/v4/connections/<connectionId>",
                "type": "EVPL_VC",
                "uuid": "<connectionId>",
                "state": "PROVISIONED",
                "name": "TEST-CONNECTION-NAME"
            },
            "summary": {
                "mean": 0,
                "max": 0
            },
             "datapoints": [
                {
                    "endDateTime": "2025-05-12T19:28:59.000Z",
                    "value": 0
                },
                {
                    "endDateTime": "2025-05-12T19:34:01.000Z",
                    "value": 0
                },
                {
                    "endDateTime": "2025-05-12T19:36:16.000Z",
                    "value": 0
                },
                {
                    "endDateTime": "2025-05-12T19:42:12.000Z",
                    "value": 0
                }
            ]
        },
               {
            "type": "SUM",
            "name": "equinix.fabric.connection.packets_dropped_rx_zside_rateexceeded.count",
            "unit": "packet",
            "resource": {
                "href": "https://api.equinix.com/fabric/v4/connections/<connectionId>",
                "type": "EVPL_VC",
                "uuid": "<connectionId>",
                "state": "PROVISIONED",
                "name": "TEST-CONNECTION-NAME"
            },
            "summary": {
                "mean": 0,
                "max": 0
            },
             "datapoints": [
                {
                    "endDateTime": "2025-05-12T19:28:59.000Z",
                    "value": 0
                },
                {
                    "endDateTime": "2025-05-12T19:34:01.000Z",
                    "value": 0
                },
                {
                    "endDateTime": "2025-05-12T19:36:16.000Z",
                    "value": 0
                },
                {
                    "endDateTime": "2025-05-12T19:42:12.000Z",
                    "value": 0
                }
            ]
        },
        {
            "type": "SUM",
            "name": "equinix.fabric.connection.packets_dropped_tx_zside_rateexceeded.count",
            "unit": "packet",
            "resource": {
                "href": "https://api.equinix.com/fabric/v4/connections/<connectionId>",
                "type": "EVPL_VC",
                "uuid": "<connectionId>",
                "state": "PROVISIONED",
                "name": "TEST-CONNECTION-NAME"
            },
            "summary": {
                "mean": 0,
                "max": 0
            },
             "datapoints": [
                {
                    "endDateTime": "2025-05-12T19:28:59.000Z",
                    "value": 0
                },
                {
                    "endDateTime": "2025-05-12T19:34:01.000Z",
                    "value": 0
                },
                {
                    "endDateTime": "2025-05-12T19:36:16.000Z",
                    "value": 0
                },
                {
                    "endDateTime": "2025-05-12T19:42:12.000Z",
                    "value": 0
                }
            ]
        }
    ]
}
正在创建衡量指标警报
使用Stream Alert Rule Management API在度量超过定义的阈值时创建事件。有关更多信息,请参阅管理指标警报规则
接收器集成中的接收指标
创建数据流并将资产添加到该数据流后,您可以创建订阅,通过订阅数据流将度量发送给您选择的第三方数据收集器。