The Smart View Portal
The Smart View Portal provides real-time visibility into the environmental, power draw, mechanical, and electrical conditions of your IBX data center footprint.
Signing In to the Smart View Portal
You can access the Equinix Smart View dashboard directly, or through the Equinix Customer Portal.
Direct access to the Smart View port is at ibxsmartview.equinix.com.
If you don't have an account, contact the Global Service Desk (GSD).
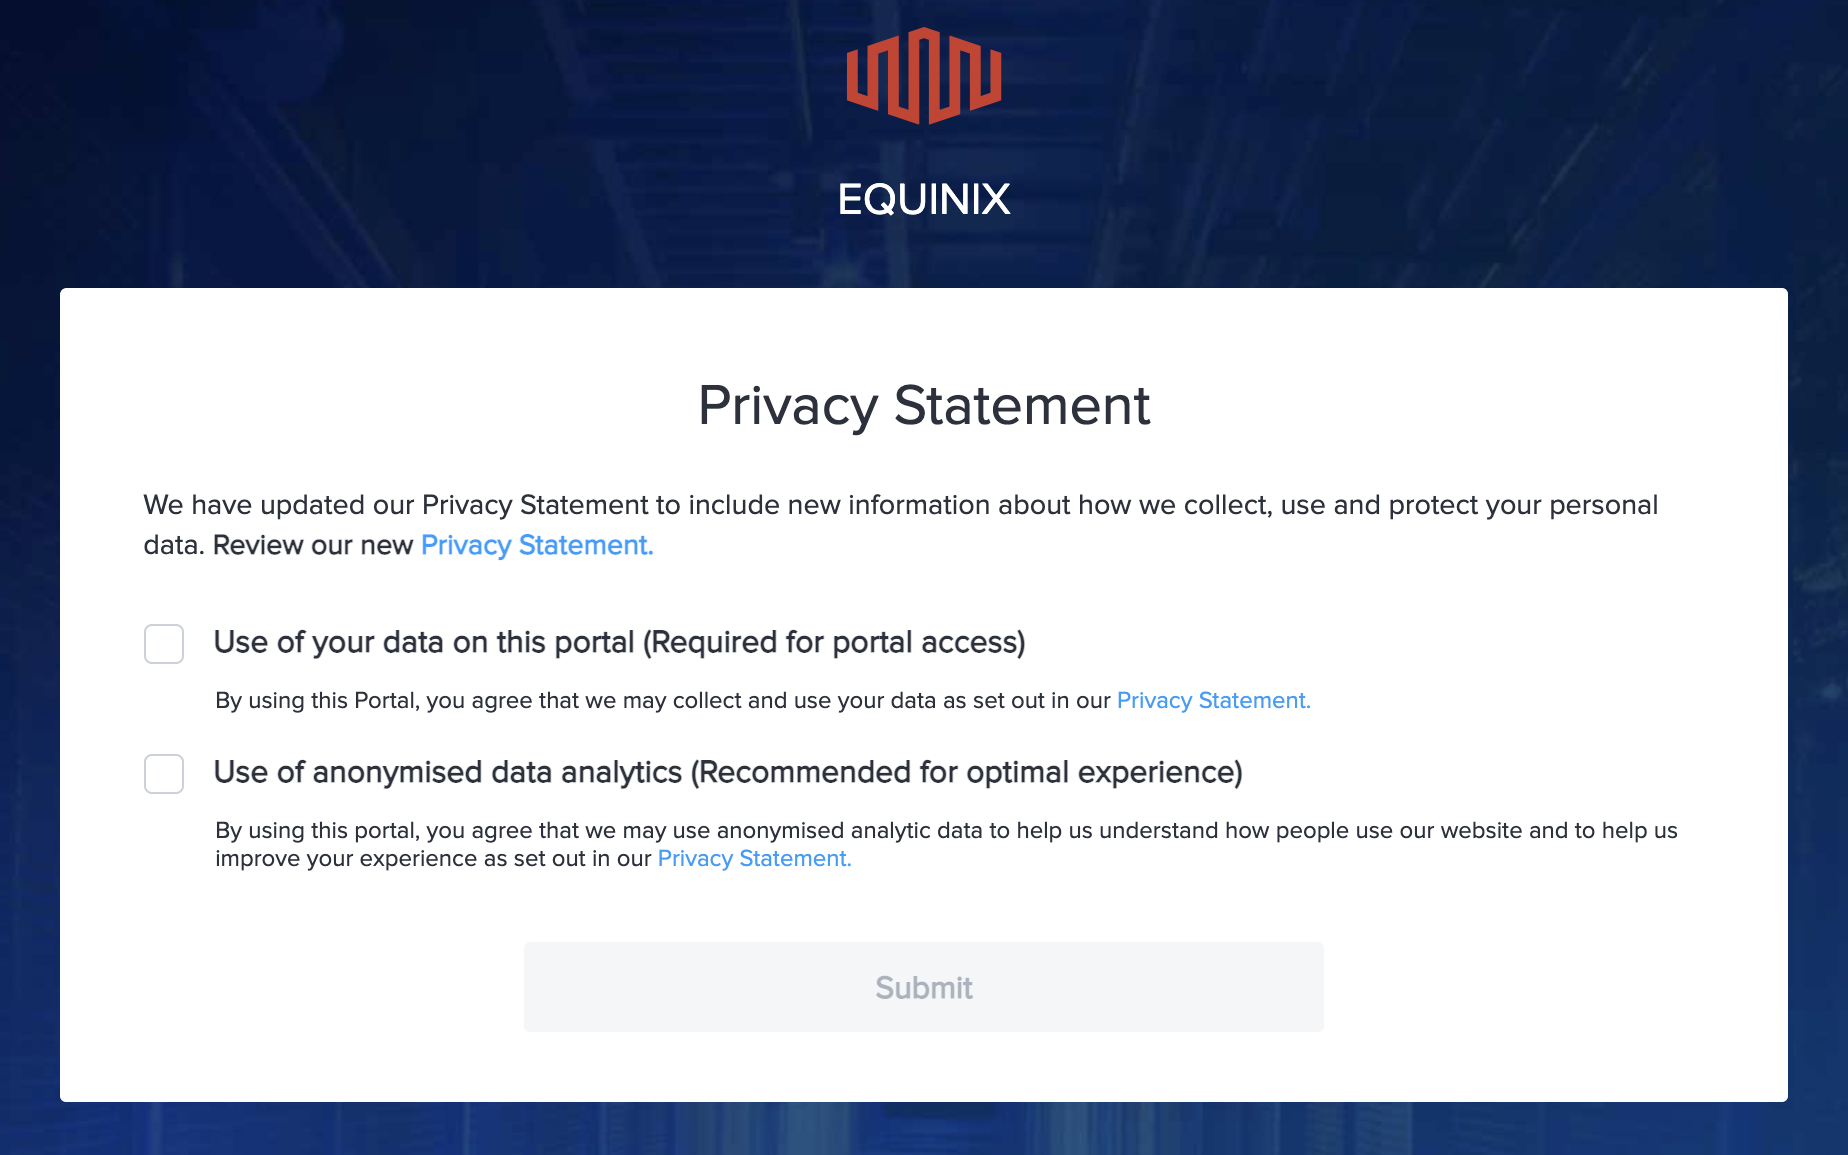
If prompted, review and acknowledge the privacy statement, and click Submit. The privacy statement only appears for users who haven't provided consent yet, or users who have withdrawn consent.
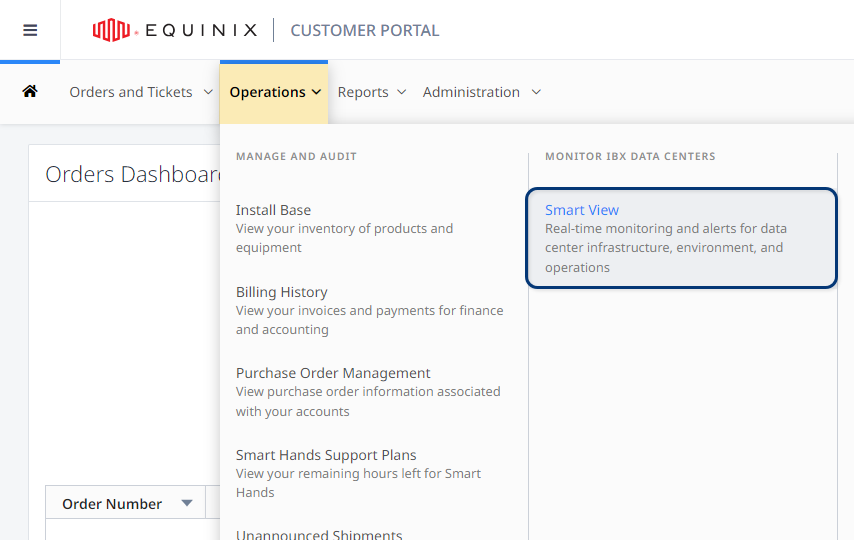
To access the Smart View Portal from the Customer Portal, navigate to the Colocation Dashboard. From the Operations menu, select Smart View.
Permissions
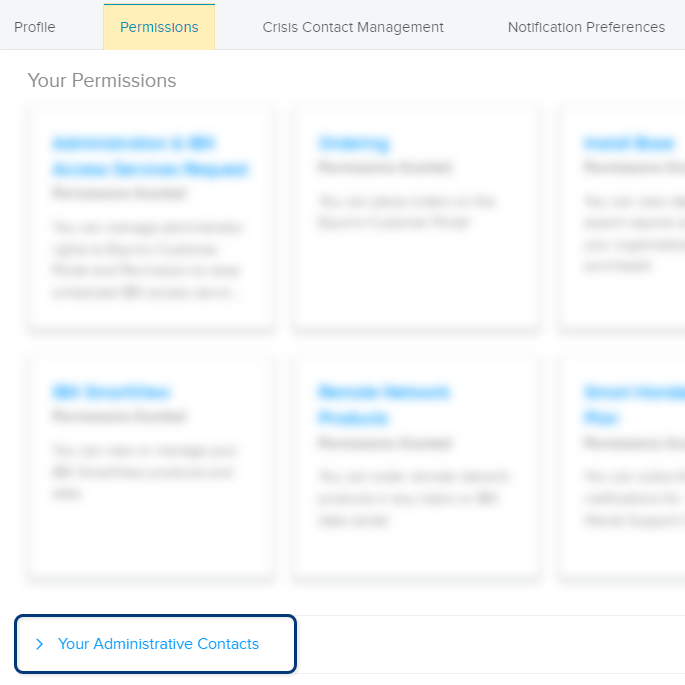
To see your current permissions:
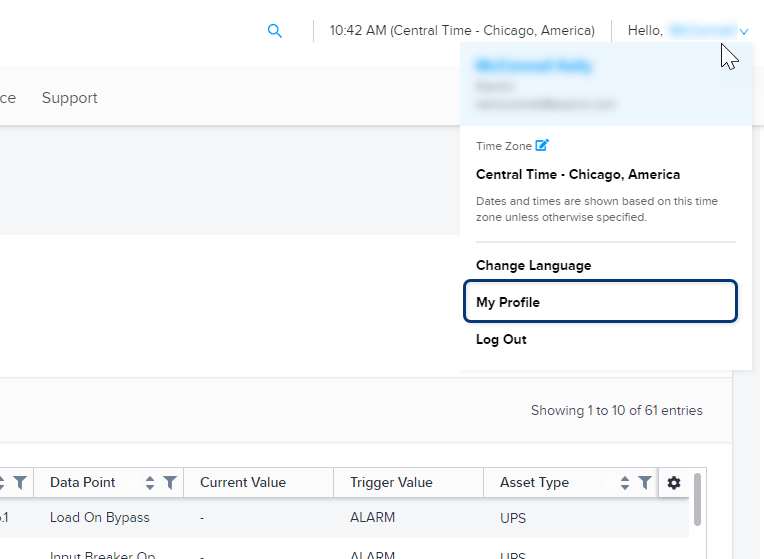
In the Smart View portal, select My Profile.
Your profile opens in the Equinix Customer Portal. Select the Permissions tab, then click Smart View.
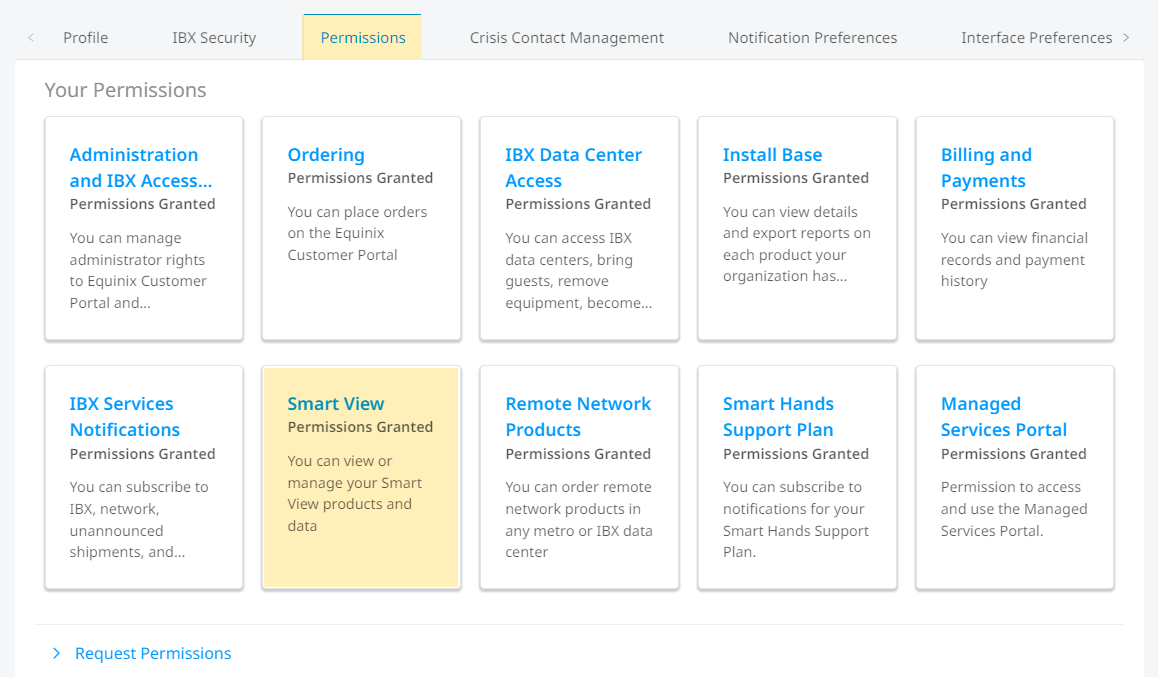
The system shows your current permissions:
| Icon | Meaning |
|---|---|
| green checkmark | You have permission |
| red lock | You do not have permission |
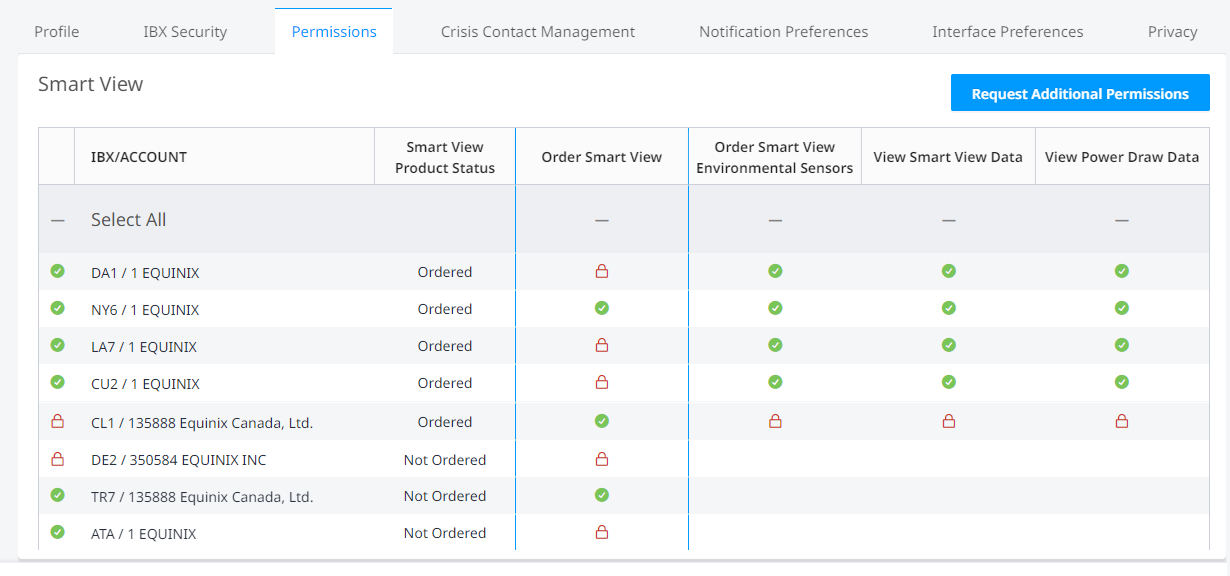
If you need additional permissions, see Requesting Additional Permissions or contact your company's portal administrator. If you don't know who to contact, return to the Permissions tab and click Your Administrative Contacts.
If you're an administrator, you can add new users from your organization, modify existing users, and invite users. To add or change Smart View permissions for an existing user, see Managing User Permissions.
Smart View Dashboard
The Smart View dashboard provides insight into the current operational status of your IBX data center footprint. To access the dashboard from any screen in the Smart View Portal, click the Home icon.
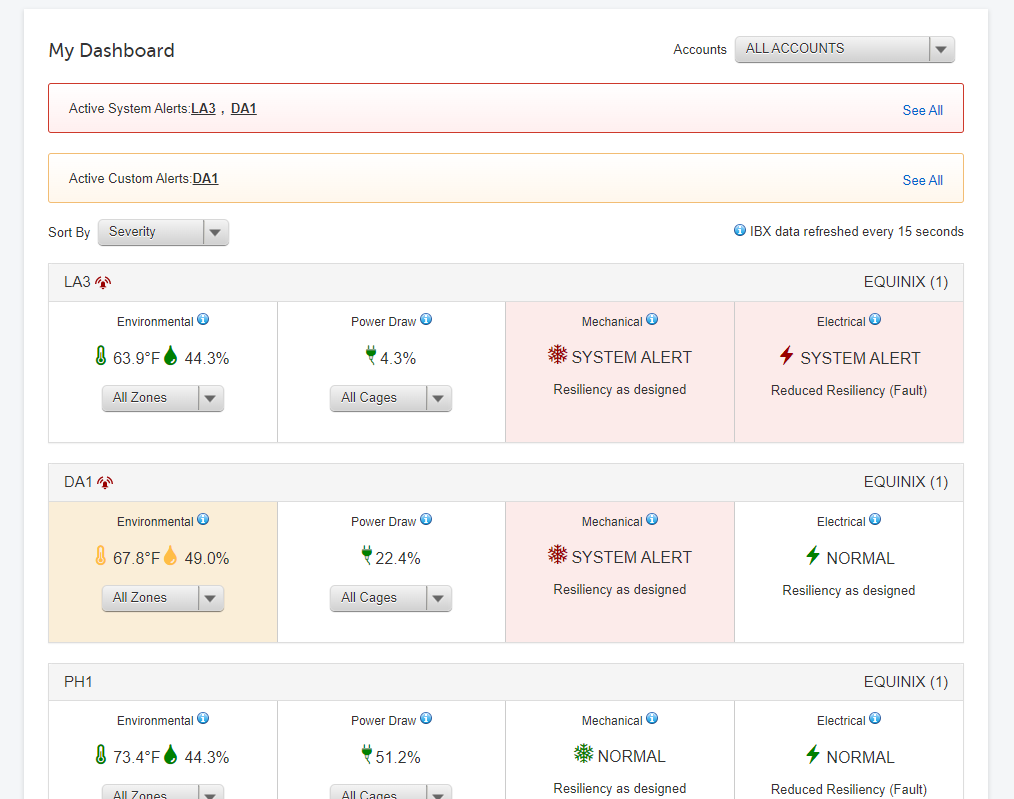
The system divides asset data into the following categories:
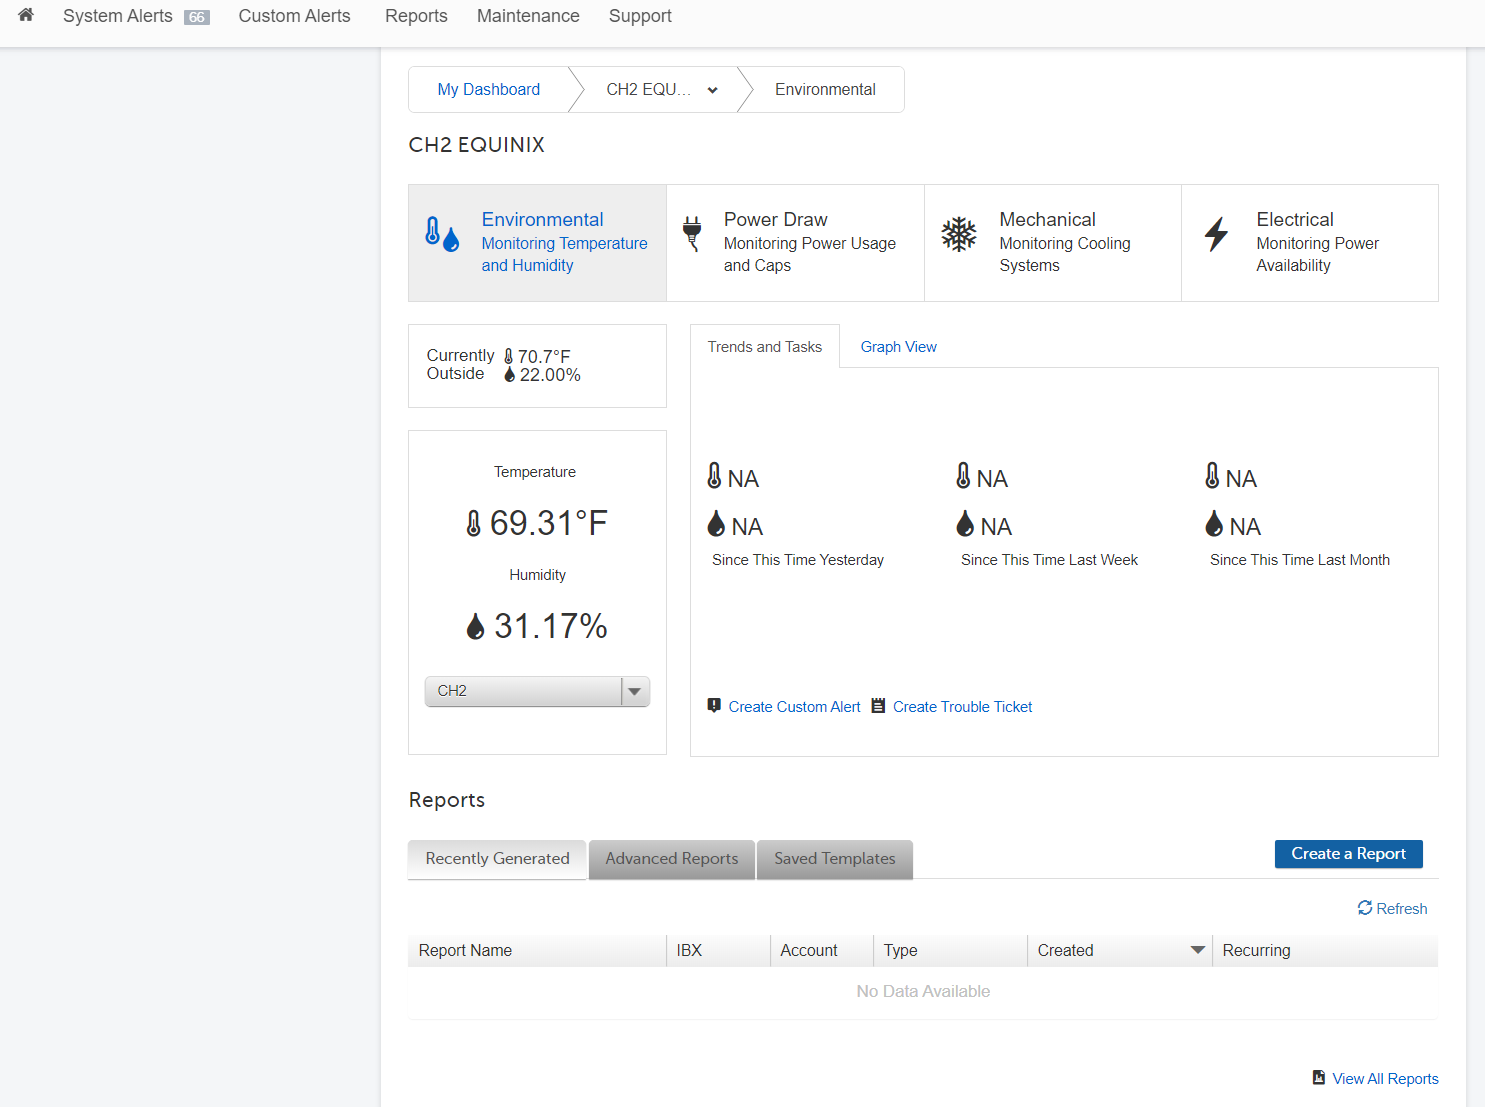
- Environmental – Temperature and humidity data. View past and present temperature and humidity of your cages, cabinets, and IBX cooling zones.
- Power Draw – Power draw on each AC power circuit, aggregated to the IBX, cage, and cabinet level. View past and present power usage and capacity metrics for all AC power being supplied to your assets.
- Mechanical – Air handling, cooling, smoke and fire detection, and leak detection statuses. View the real-time operating status of the mechanical infrastructure supporting your cages and cabinets.
- Electrical – Single line circuit diagrams of electrical system and electrical asset data. View the real-time operating status of the electrical infrastructure supporting the power circuits in your cages and cabinets.
If a tile is shown in red, there is an active system alert for that IBX. If a tile is shown in yellow, there is an active custom alert.
Click a data section tile to view the asset details of a specific category. Each tile shows data from the assets in that category affecting your cages. You can add sensors to the cage, create custom alerts, trouble tickets, and reports within each data section.
Alerts and Support
Use the Smart View Portal to create and manage system alerts and custom alerts.
Use the Support tab to open tickets, create Smart Hands orders, or give feedback. See Getting Support for more details.
User Preferences
Manage how Smart View displays information in the Customer Portal. In the Smart View portal, select My Profile.
Your profile opens in the Customer Portal.
-
To change the time zone, select an option from the Time Zone drop-down list, then click Submit. Return to the Smart View portal and refresh the page to update the time zone.

-
To change the units of measure displayed in Smart View, click Interface Preferences.
For Units of Measurement, select Standard International or U.S. Customary. For temperature readings in Celsius, select Standard International. For temperature readings in Fahrenheit, select U.S. Customary. Click Submit to save your changes. Return to the Smart View portal and refresh the page to update.

The Units of Measurement setting controls the display of temperature readings for Environmental assets on the Smart View Dashboard, on the Environmental data section, and on Custom alerts.