Maintenance Activity
Maintenance is critical to a healthy data center to ensure that assets operate correctly. The Maintenance screens in Equinix Smart View provide information about assets undergoing maintenance. Maintenance activity and maintenance scripts help ensure that you are aware of these maintenance events.
The Maintenance Activity section displays information about the electrical and mechanical assets currently undergoing maintenance in the data centers. This allows you to see if any of the assets supporting your cages are currently under maintenance.
The Maintenance Activity page shows the currently active maintenance events that affect your cages. This page provides details about assets currently undergoing maintenance, and a timestamp indicating when the maintenance began.
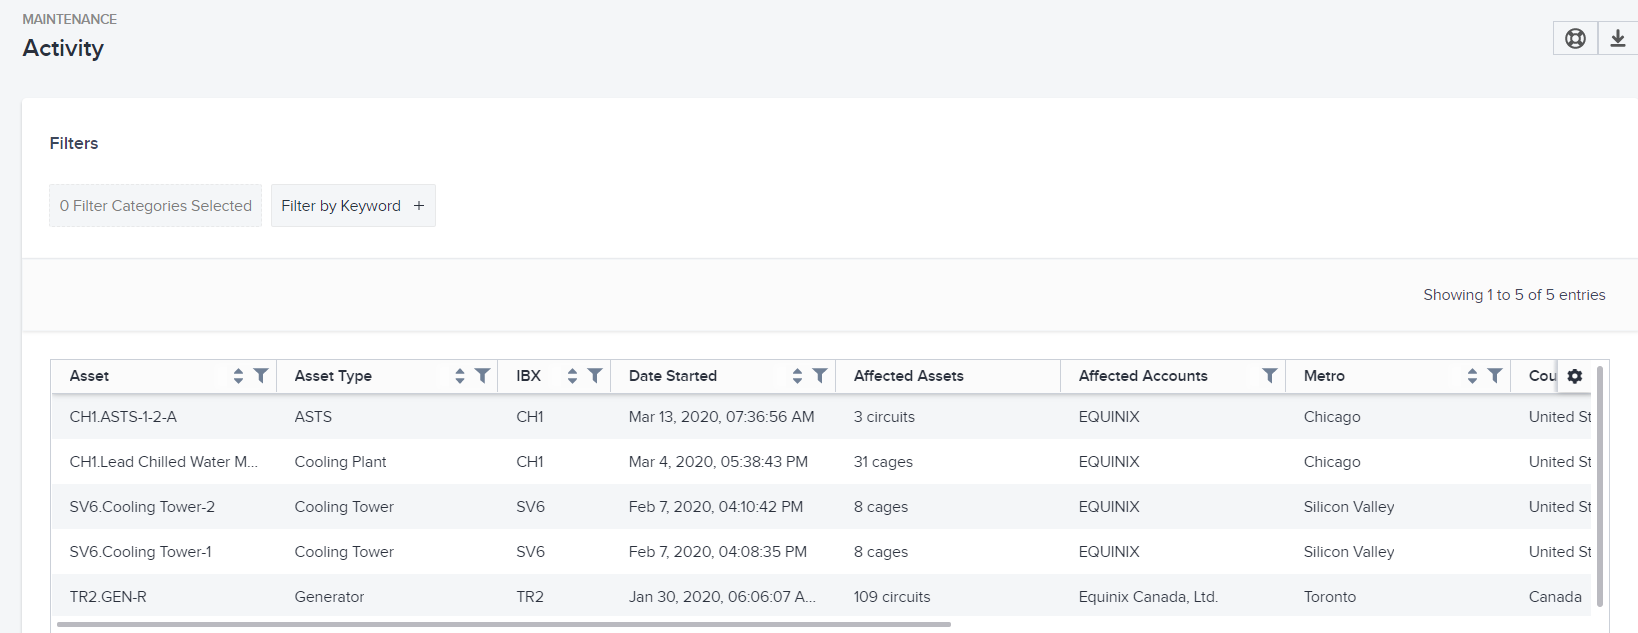
The smart data grid allows you to search, sort, and filter the columns. You can also click the gear icon to select columns to hide/show, or to rearrange the columns. For details, see Smart Data Grids.
Data Columns
By default, these columns are displayed in the grid:
| Name | Description |
|---|---|
| Asset | Unique identifier for each asset. |
| Asset Type | Type of asset (for example, Chiller, ATS). |
| IBX | All data centers that are presently undergoing scheduled maintenance. (This only shows data centers for which you have a subscription to Smart View.) |
| Date Started | Date and time when maintenance for the asset began. |
| Affected Assets | Number of cages or circuits supported by the asset under maintenance. |
| Affected Accounts | Number of accounts affected by the maintenance event. |
| Metro | Metropolitan area where the asset resides. |
| City | City where the asset resides. |
| Region | Region where the asset resides. |
| Asset Classification | Category of the asset (for example, Electrical, Mechanical). |
| Manufacturer | Manufacturer of the asset. |
| Equipment Model | Model number of the asset equipment. |
All Electrical assets map to circuits and all Mechanical assets map to cages.
Note:
- You cannot hide the IBX, Asset, and Asset Type columns.
- You can filter and sort all columns except Affected Assets and Affected Accounts.
View Details for a Row
Click a row in the data grid to see details about a specific maintenance event:
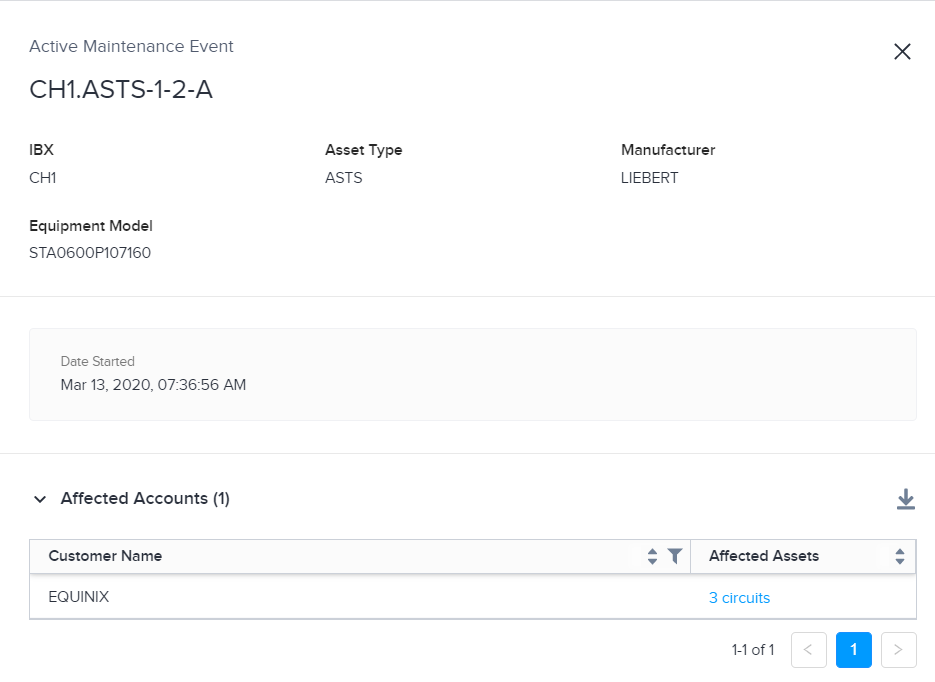
The top half of the panel shows:
- The IBX where the asset infrastructure resides.
- The asset type and manufacturer of the infrastructure.
- The equipment model number.
- The start date and time of the maintenance event.
The bottom half displays the affected assets and their account numbers.
Click the number of affected circuits under Affected Assets to see circuit details.
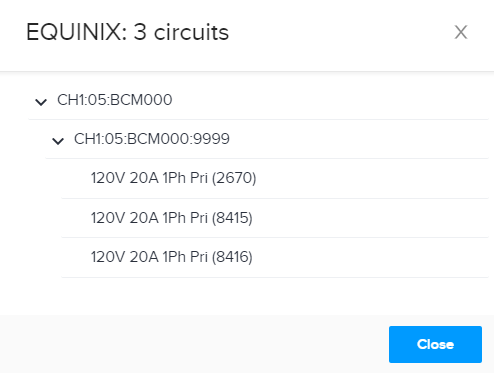
The first level represents a cage, the second level indicates a cabinet, and the third level refers to a circuit.
The circuit name provides details on the power parameters—indicating voltage, current, and phase—along with the last four digits of the circuit's serial number.
Export Data to a File
To save the data to a CSV file:
-
Arrange the data you want to export.
tipYou can set filters, use the search box, choose a sort column, hide columns, and rearrange columns.
-
Click the download icon.
The system downloads a .csv file to your device.
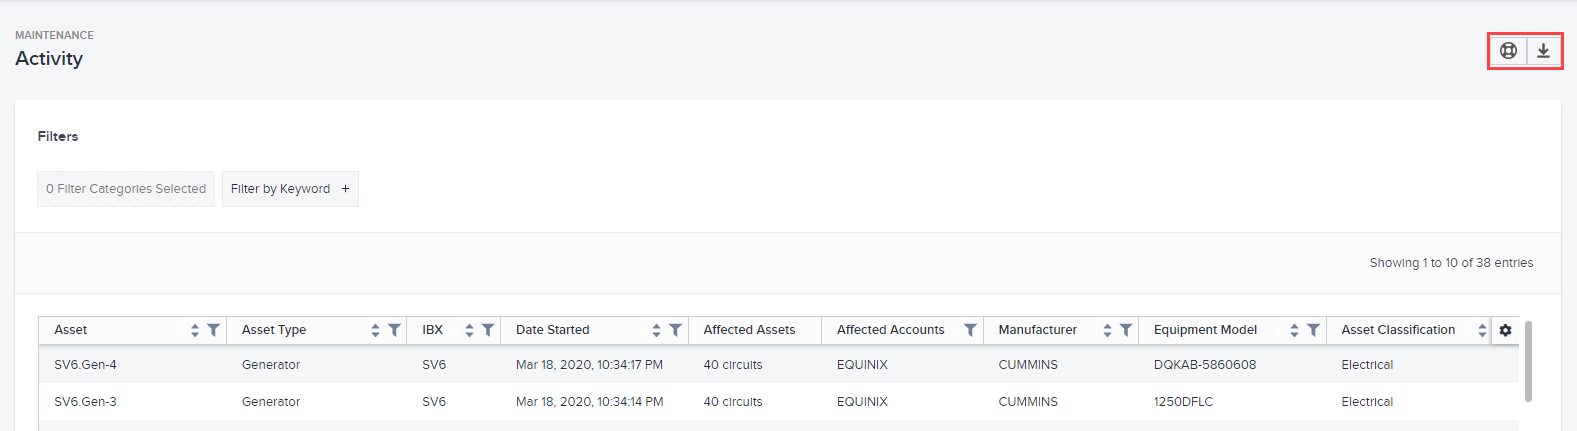
Create a Trouble Ticket
To submit a trouble ticket to Equinix, click Trouble Ticket at the top right corner (above the data grid). See also the Support page.