Power Draw Data
Smart View Power Draw data provides the near real-time power usage of the power circuits in your cages and cabinets. You can view the total and contracted kVA draw and ratio for all cages, cabinets, and circuits in your IBX in the Smart View portal and API.
In order to access your Power Draw data, you need Smart View and View Power Draw Data permissions for each of your IBX locations.
Current Power Draw
- Portal
- API
Sign in to the Smart View portal. If you are signed into the Customer Portal, select Smart View from the global navigation menu.
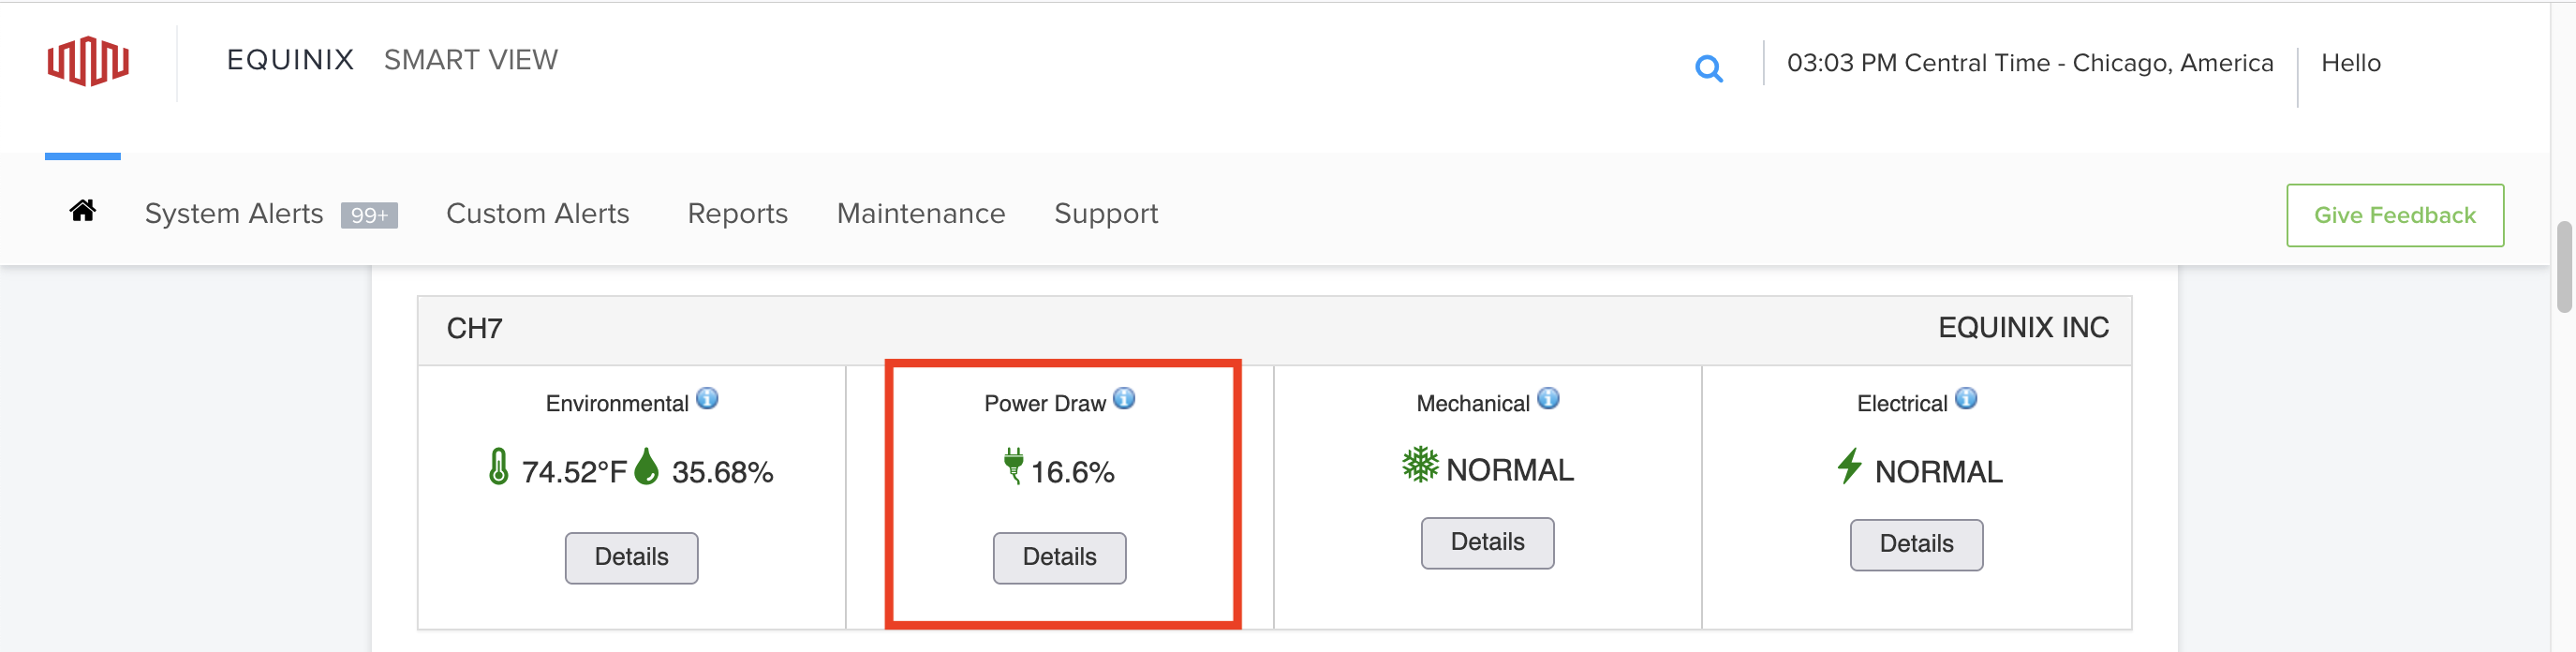
To view current power draw data, select an IBX location from your Dashboard and click Details in the Power Draw tile.
The Current Power Draw graph shows:
- Total Draw-to-Contracted kVA ratio
- Total kVA draw
- Contracted kVA (power draw cap)

Use the drop-down filter to view the power draw for a zone, cage, or circuit in the IBX.
If you are using the API, you must submit an authentication token, see API Authentication for instructions.
To view power draw data, send a GET request to the /power/v1/current endpoint. Specify your account number and IBX location information as a query parameter in your request.
Sample cURL request:
curl -X GET 'https://api.equinix.com/power/v1/current?accountNo=<your_account_no>&ibx=<ibx_code>&levelType=ibx&levelValue=<ibx_code>'
-H 'Authorization: Bearer <token>'
To further filter your data to a specific cage, cabinet, or circuit, use the additional query parameters.
Sample cURL request:
curl -X GET 'https://api.equinix.com/power/v1/current?accountNo=<your_account_no>&ibx=<ibx_code>&levelType=cabinet&levelValue=<cabinet_id>'
-H 'Authorization: Bearer <token>'
If you do not know the IBX code, cage ID, cabinet ID, or circuit ID, use the /smartview/v1/hierarchy/power endpoint to retrieve your power hierarchy data.
Trends and Tasks
- Portal
- API
The Trends and Tasks tab shows the 7-day peak draw cap over different time periods:
- Now compared to yesterday.
- Now compared to last week.
- Now compared to last month.
- Now compared to last quarter.

Use the Current Power Draw drop-down filter to filter the data to a zone, cage, or circuit in the IBX.
To view 7-day peak draw cap comparison data, send a GET request to the /power/v1/current endpoint. Specify your account number and IBX location information as a query parameter in your request.
Sample cURL request:
curl -X GET 'https://api.equinix.com/power/v1/current?accountNo=<your_account_no>&ibx=<ibx_code>&levelType=ibx&levelValue=<ibx_code>'
-H 'Authorization: Bearer <token>'
The responses comparisonData object, contains the peak percentage kVA comparison between percentageKva and yesterday, lastWeek, lastMonth, and lastQuarter.
Sample response (truncated):
...
"percentageKva": 341.54,
"comparisonData": {
    "datapoint": "percentageKva",
    "yesterday": 0.147,
    "lastWeek": -0.295,
    "lastMonth": -0.184,
    "lastQuarter": 52.434
},
...
To further filter your comparison data to a specific cage, cabinet, or circuit, use the additional query parameters.
Sample cURL request:
curl -X GET 'https://api.equinix.com/power/v1/current?accountNo=<your_account_no>&ibx=<ibx_code>&levelType=cabinet&levelValue=<cabinet_id>' -H 'Authorization: Bearer <token>'
Graph View
- Portal
- API
You can view the power draw kVA to max allowed (%) for every 15 minute interval in a given time period. Click Graph View to view the data in a graphical format.
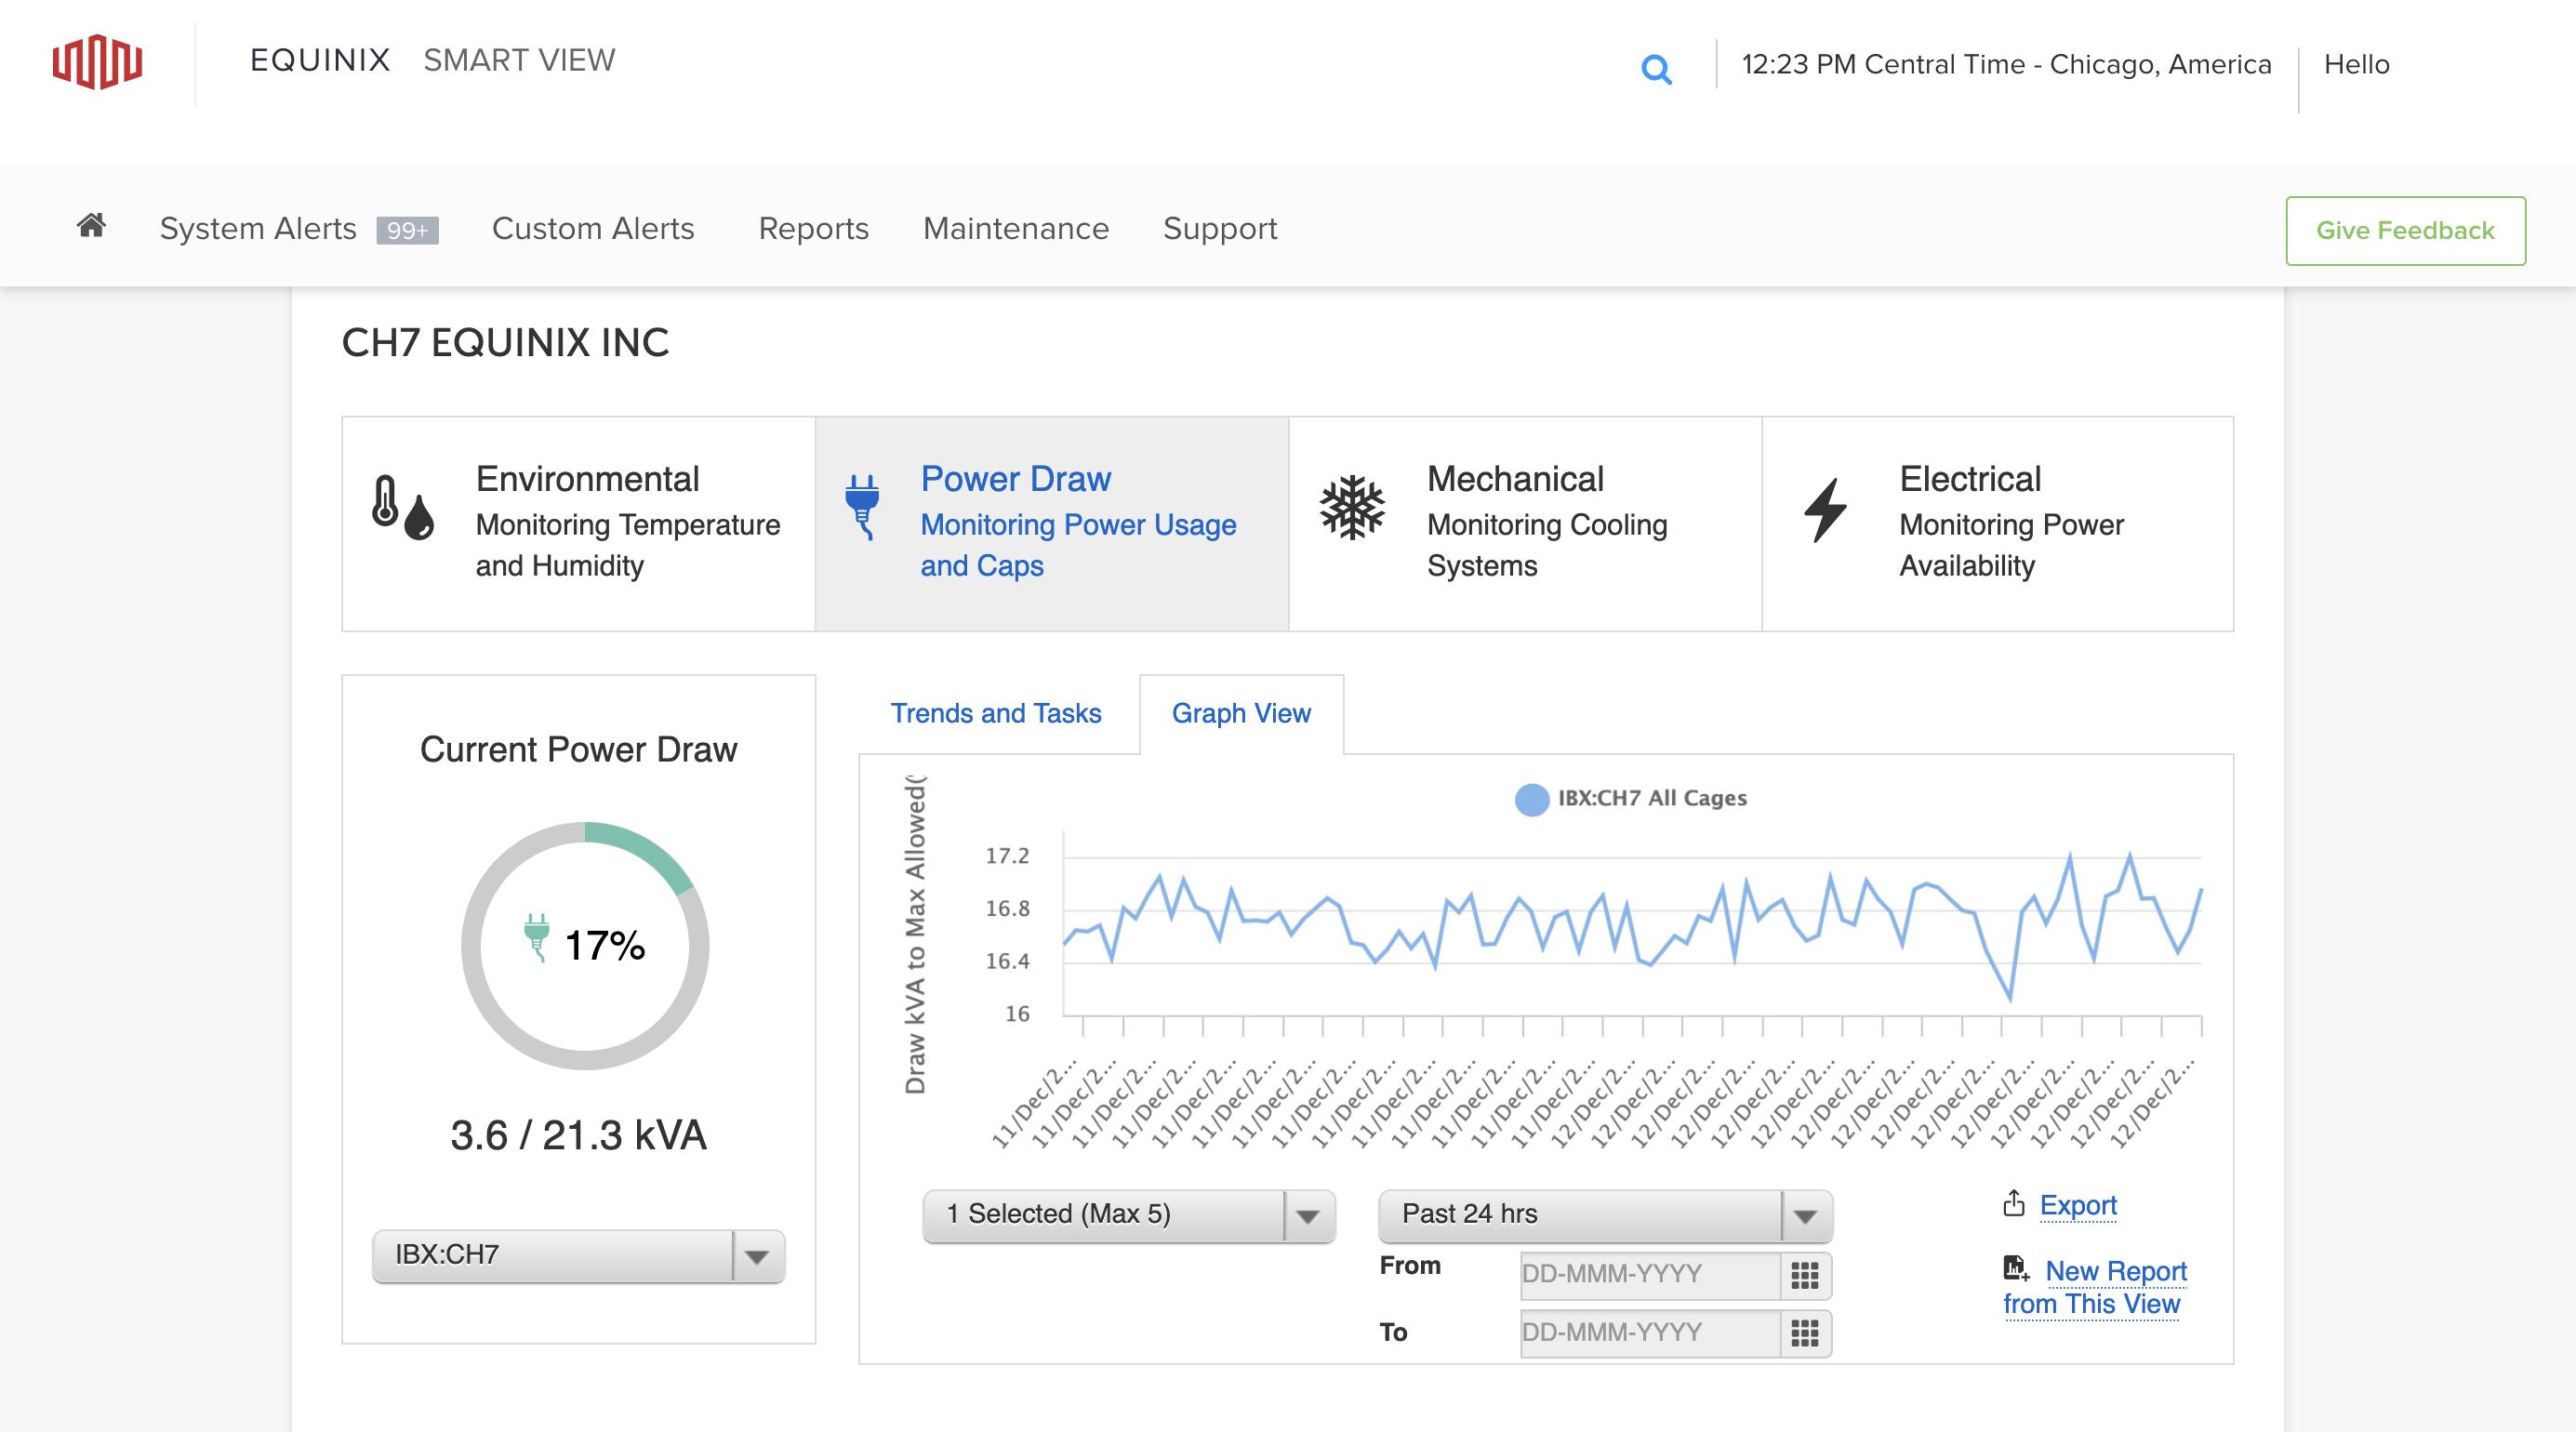
Choose up to five cages, cabinets, or circuits from the drop-down filter below the graph to see a graphical comparison of their power usage.
Choose a timeframe to trend the data you want to view from the last day, week, or month. To customize the date range, use the calendar.
To view the power draw kVA to max allowed (%) in a given time period, send a GET request to the /power/v1/trending endpoint. Use the query parameters to specify:
- Your Account number and IBX location.
- The interval of the data points, from
recording,1h, or1d. - The start time expressed as epoch time in milliseconds.
- The end time expressed as epoch time in milliseconds.
Sample cURL request:
curl -X GET 'https://api.equinix.com/power/v1/trending?accountNo=<your_account_no>&ibx=<ibx_code>&levelType=ibx&levelValue=<ibx_code>&interval=<interval>&fromDate=<epoch_timestamp_milliseconds>&toDate=<epoch_timestamp_milliseconds>'
-H 'Authorization: Bearer <token>'
To further filter your data to a specific cage, cabinet, or circuit, use the additional query parameters.
Sample cURL request:
curl -X GET 'https://api.equinix.com/power/v1/trending?accountNo=<your_account_no>&ibx=<ibx_code>&levelType=cabinet&levelValue=<cabinet_id>&interval=<interval>&fromDate=<epoch_timestamp_milliseconds>&toDate=<epoch_timestamp_milliseconds>'
-H 'Authorization: Bearer <token>'
Cages
The Cages table displays details of the power draw for your cages, cabinets, and circuits within the IBX.
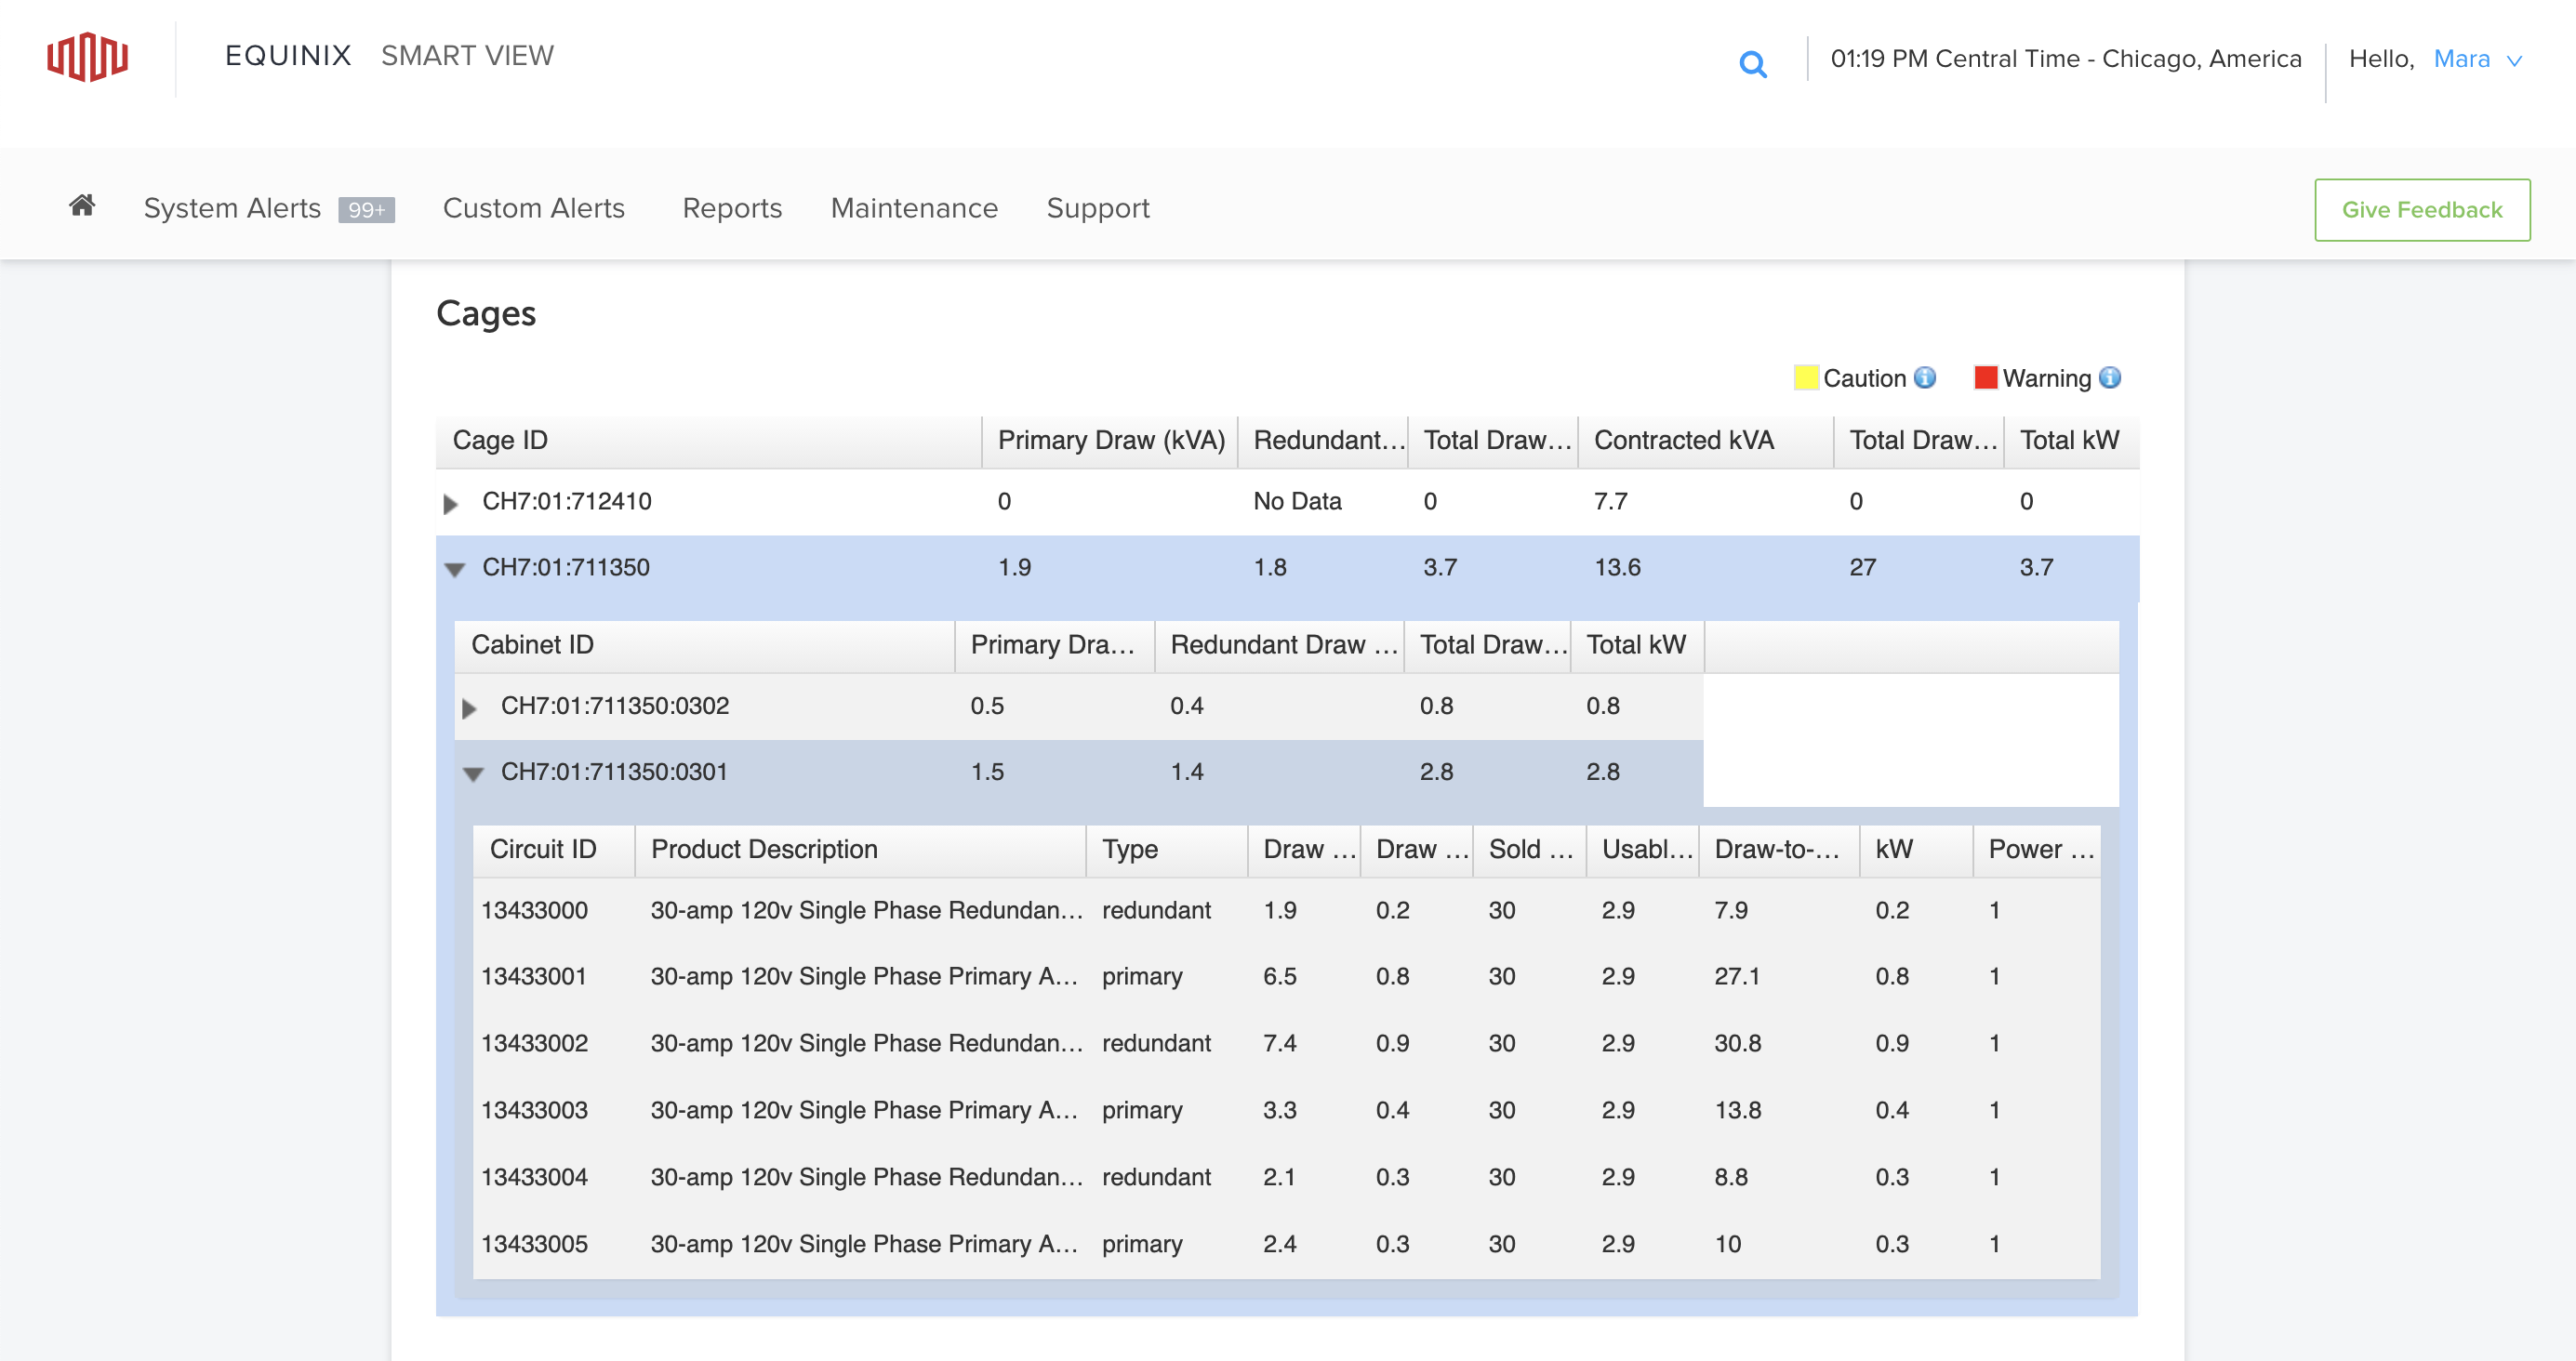
Expand each cage to view cabinet data. Expand each cabinet to the circuit level for detailed information.
Colored highlighting indicates that a cage, cabinet, or circuit is approaching its draw cap level of total-to-contracted kVA ratio (%).
- When the power draw of an asset is within 10% of its draw cap, the system highlights the Total Draw-to-Contracted kVA % value in yellow.
- When the power draw of an asset exceeds its draw cap, the system highlights the Total Draw-to-Contracted kVA % value in red.
Generate Reports
Export the configured trend of a dataset to create a report. You can generate a PDF document from the data used to generate the trend.
Create specific reports or view all Recently Generated reports, Advanced Reports, and Saved Templates from the lower section of the page.
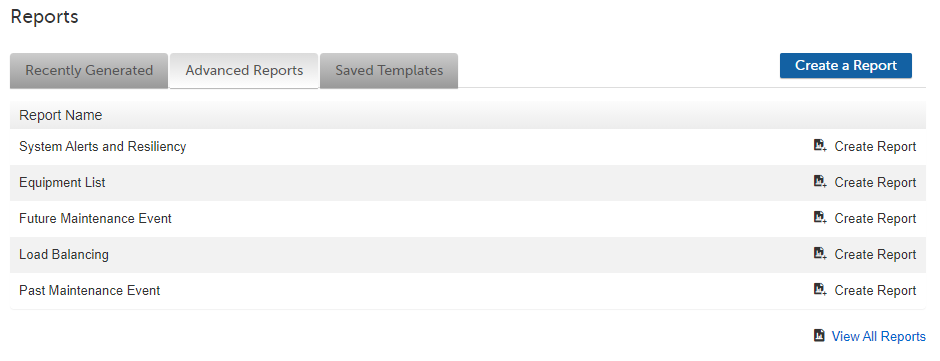
See Reports for details of all generated reports.