Environmental Data
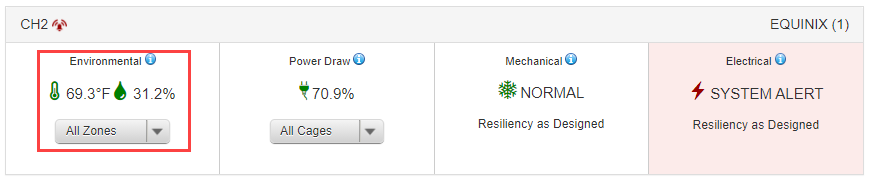
The Environmental data section displays the near real-time temperature and humidity conditions for an entire IBX, and for the cooling zones where your cages reside. You can use this section to monitor these conditions.
A cooling zone is an area of the data center supported by common mechanical infrastructure.
To specify whether temperature is shown in Fahrenheit or Celsius, see User Preferences.
Temperature and Humidity Data
- Portal
- API
If your organization purchased environmental sensors, you can view the temperature and humidity data at a cabinet and cage level on this page.
To view this information, select All Zones or a specific zone from the Environmental tile of an IBX on the Dashboard.
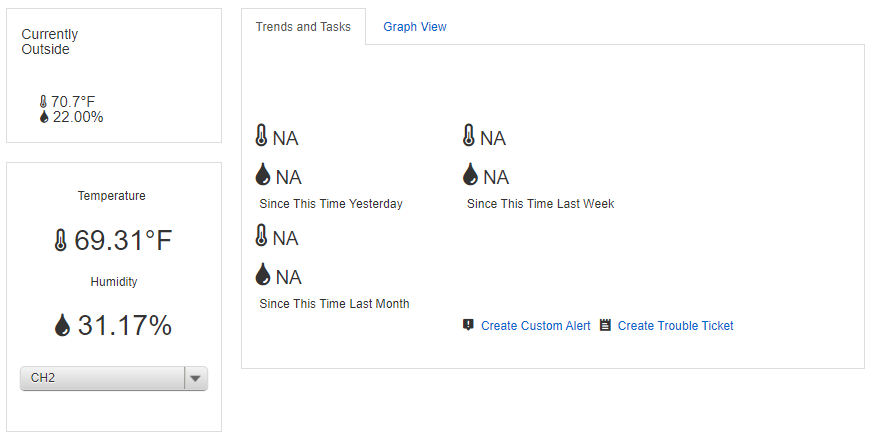
This page shows:
-
The current temperature and humidity outside the IBX
-
The average temperature and humidity of all cooling zones inside the IBX
-
The median temperature and humidity of all environmental sensors inside a cooling zone
We use median readings because sensors in a cooling zone are installed at various locations to monitor and manage the operation of the cooling plant, and the heat load generated by the equipment at the site. These locations include hot air returns, cold air distribution, areas near the ceiling, and areas in the cages.
-
Trends of environmental conditions over different time periods, such as now compared to yesterday, now compared to last week, and now compared to last month
-
An option to create custom alerts
-
The ability to view, customize, and export a trend of environmental data
If you are using the API, you must submit an authentication token, see API Authentication for instructions.
To view temperature and humidity data, send a GET request to the /environment/v1/current endpoint. Specify your account number and IBX location information as query parameters in your request.
Sample cURL request:
curl -X GET 'https://api.equinix.com/environment/v1/current?accountNo=<your_account_no>&ibx=<ibx_code>&levelType=IBX&levelValue=<ibx_code>'
-H 'Authorization: Bearer <token>'
To further filter your data, use levelType with one of the supported values: IBX, ZONE, CAGE, or SENSOR, and provide the matching levelValue.
Sample cURL request:
curl -X GET 'https://api.equinix.com/environment/v1/current?accountNo=<your_account_no>&ibx=<ibx_code>&levelType=CAGE&levelValue=<cage_id>'
-H 'Authorization: Bearer <token>'
If you do not know the IBX code, zone, or cage ID, use the /smartview/v1/hierarchy/location endpoint to retrieve your location hierarchy data.
Cooling Zone Data
- Portal
- API
To see the temperature and humidity within a specific cooling zone, choose it from the drop-down list in the IBX.
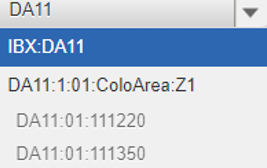
These environmental readings are only available for cages/cabinets that have environmental sensors installed.
To view cooling zone data, send a GET request to the /environment/v1/current endpoint. Specify your account number and IBX location information as query parameters in your request.
Sample cURL request:
curl -X GET 'https://api.equinix.com/environment/v1/current?accountNo=<your_account_no>&ibx=<ibx_code>&levelType=ZONE&levelValue=<zone_id>'
-H 'Authorization: Bearer <token>'
The response returns the current environmental readings for the specified location, including values such as temperature, humidity, and the reading timestamp.
Sample response (truncated):
{
  "temperature": 72.5,
  "humidity": 45.2,
  "timestamp": "2024-05-01T14:30:00Z"
}
To further filter your data to a specific cage, use levelType=CAGE with the cage ID as the levelValue.
Sample cURL request:
curl -X GET 'https://api.equinix.com/environment/v1/current?accountNo=<your_account_no>&ibx=<ibx_code>&levelType=CAGE&levelValue=<cage_id>'
-H 'Authorization: Bearer <token>'
Data Trends
- Portal
- API
Switch to Graph View to view the data in Trends and Tasks in a graphical format.
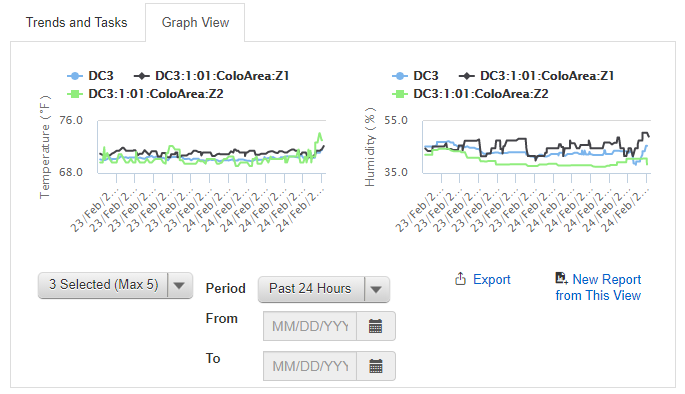
Choose up to five cooling zones or cabinets from the drop-down filter below the graph to see a graphical comparison of their environmental conditions. The system synchronizes selections between both graphs.
Choose a timeframe to trend the data you want to view from the last day, week, or month. To customize the date range, use the calendar.
To view trending environmental data, send a GET request to the /environment/v1/trending endpoint. Specify your account number, IBX location, data point, level type, level value, interval, and date range as query parameters in your request.
Sample cURL request:
curl -X GET 'https://api.equinix.com/environment/v1/trending?accountNo=<your_account_no>&ibx=<ibx_code>&dataPoint=<temperature|humidity>&levelType=<IBX|ZONE|CAGE|SENSOR>&levelValue=<level_value>&interval=<interval>&fromDate=<ISO8601_datetime>&toDate=<ISO8601_datetime>'
-H 'Authorization: Bearer <token>'
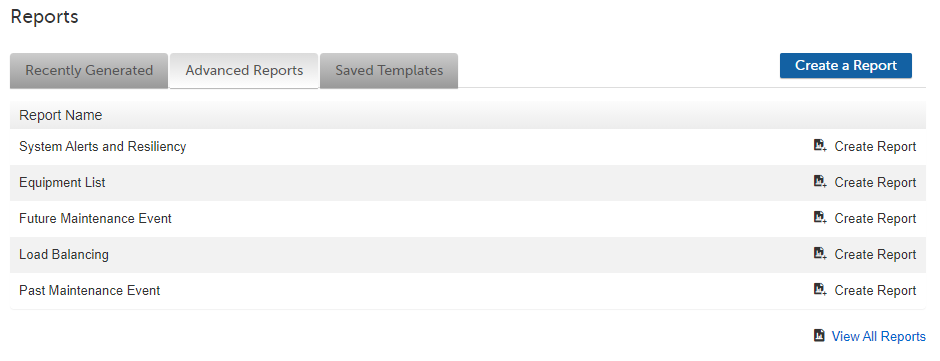
Generate Reports
Export the configured trend of a dataset to create a report. You can generate a PDF document from the data used to generate the trend.
Create specific reports or view all Recently Generated reports, Advanced Reports, and Saved Templates from the lower section of the page.