Alerts Overview
Smart View provides a single place to see, configure, and manage all of your alerts. Alerts are grouped by type:
-
System Alerts - System Alerts are Equinix-defined alerts for Mechanical and Electrical assets. They are standardized across all IBX data centers. Alert definitions are pre-defined and cannot be changed. See the Mechanical System Alerts Reference and the Electrical System Alerts Reference for alarm definitions.
-
Power Alerts - Power Alerts are customer-defined alerts for asset-level power draw; for example, cage, cabinet, or circuit draw. Equinix is not notified when your Power alerts activate.
-
Environmental Alerts - Environmental Alerts are customer-defined alerts for temperature and humidity. Equinix is not notified when your Environmental alerts activate. Note: Smart View Environmental Alerts are only available to customers with existing Customer-owned Smart View Wifi environmental sensors that are already installed in their cage(s). This product is not available for new installations.
System Alerts and Custom Alerts used to be on separate sections of the Smart View Portal. They now share one location and experience.
Viewing Alerts
The View Smart View Data permission is required to access the Smart View Dashboard. If you do not have access, click Request Access to contact your administrator. For more information, see Smart View Permissions.
To view Alerts:
-
Sign in to the Customer Portal and navigate to Smart View
-
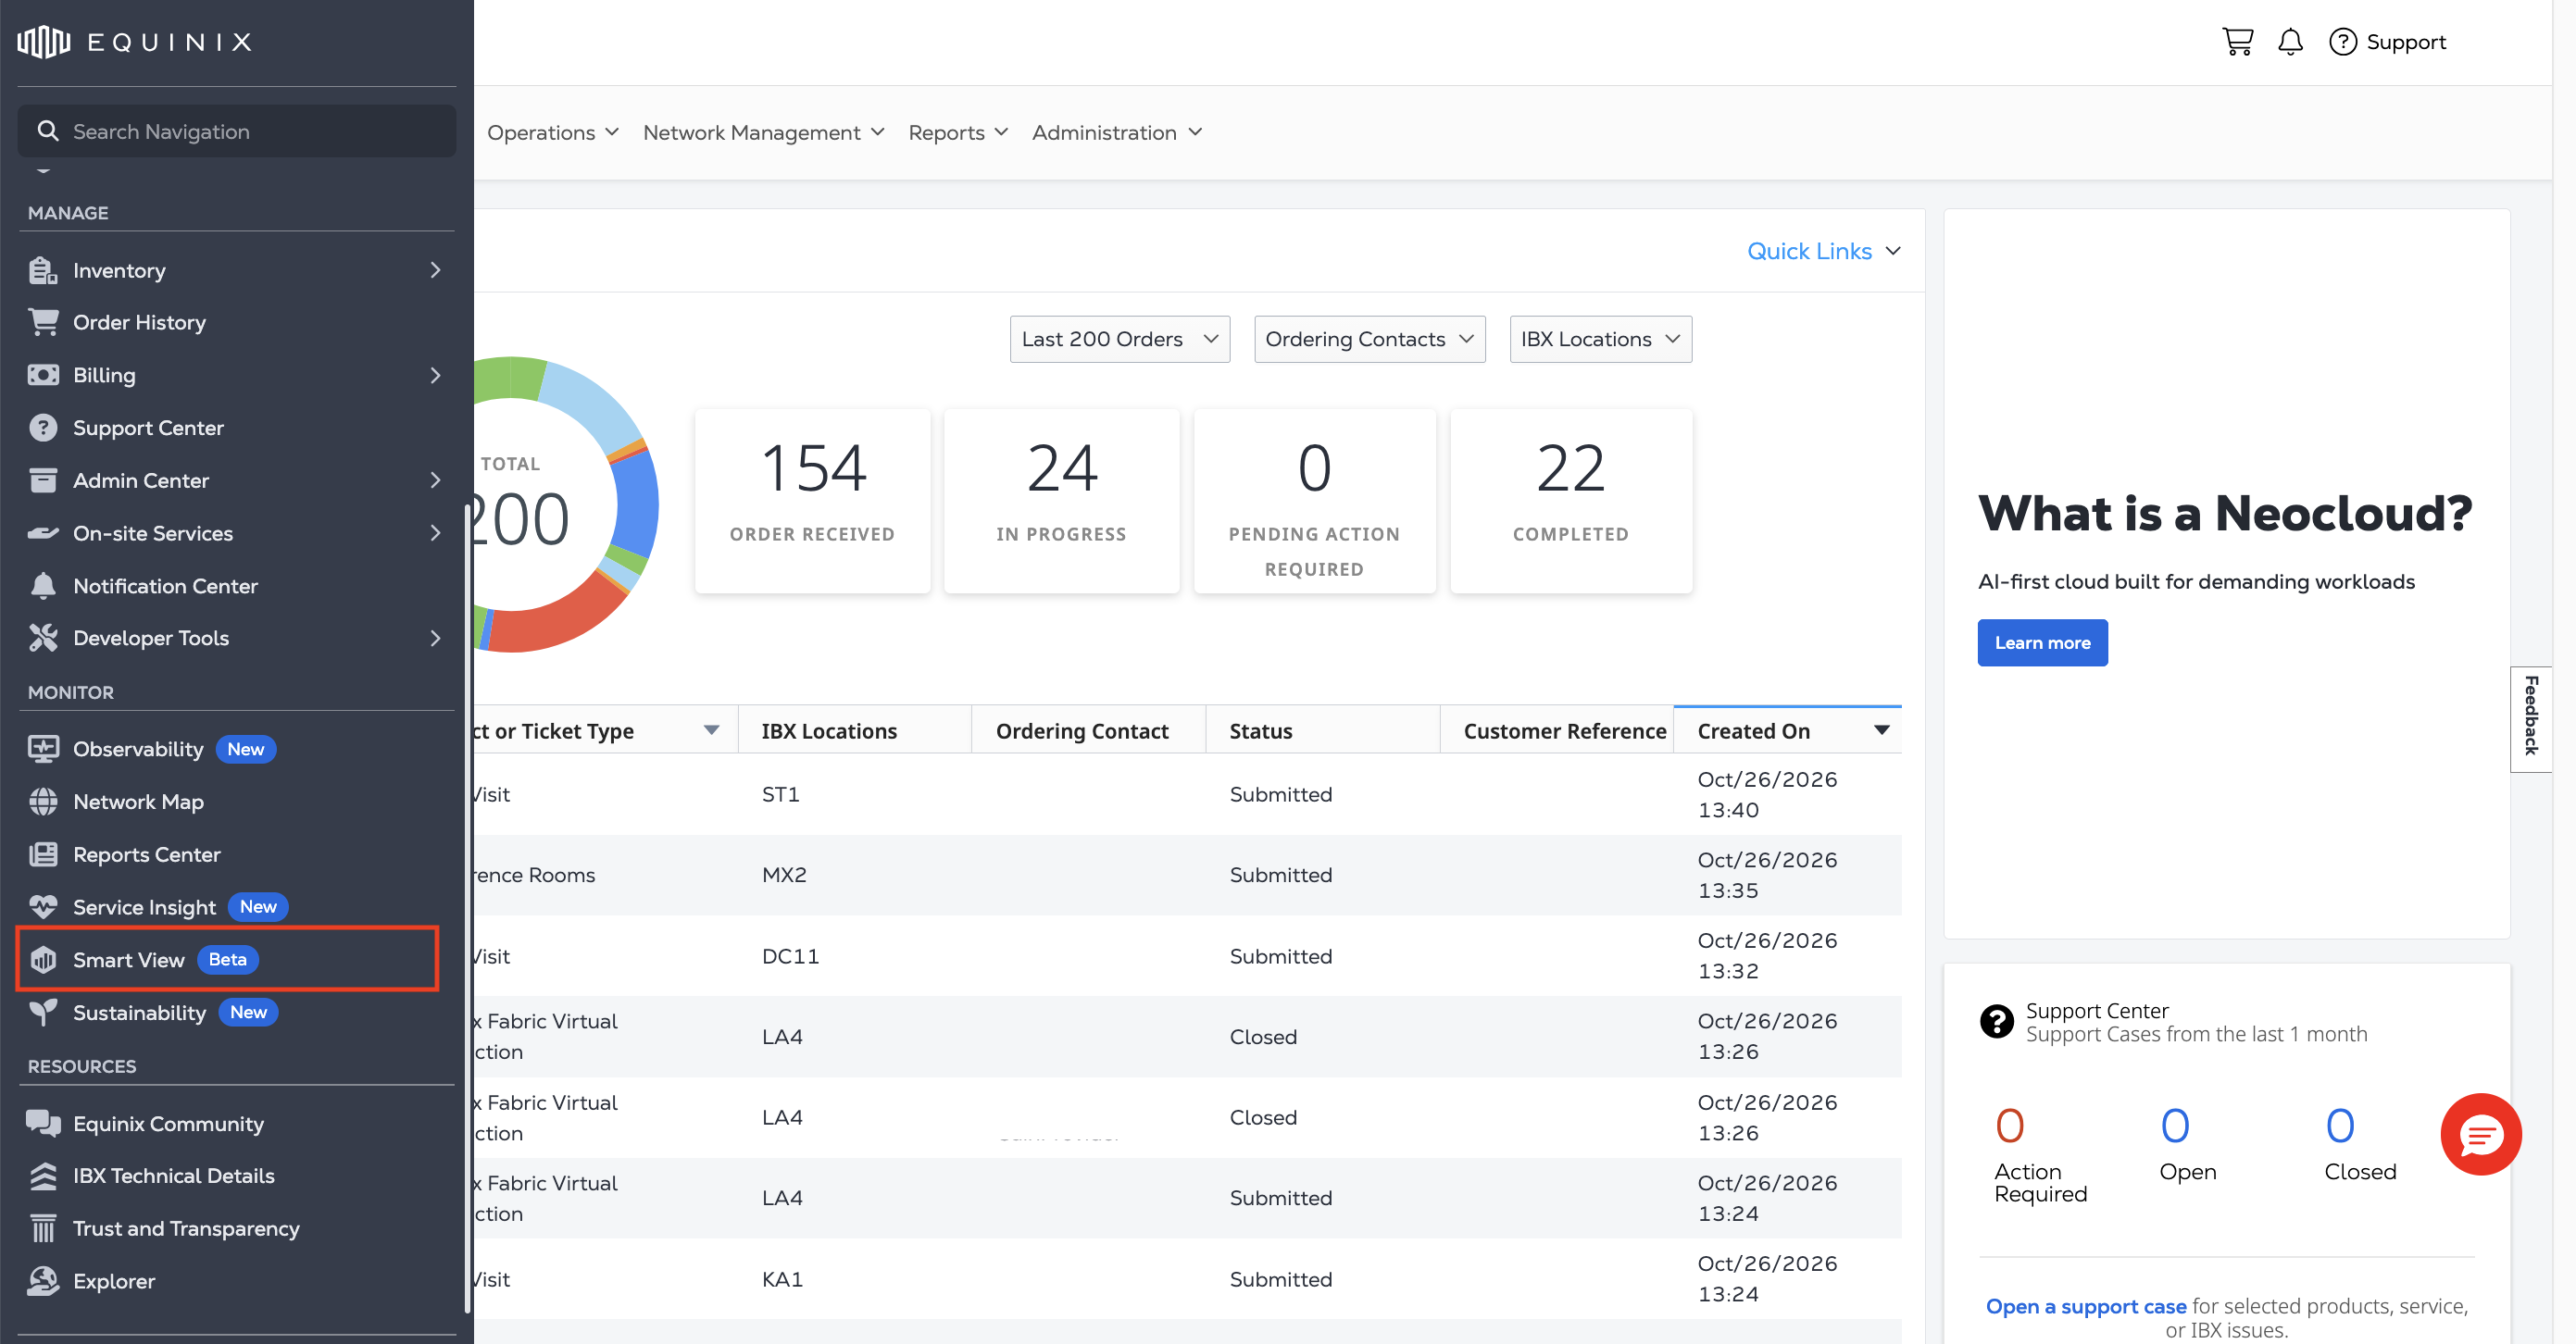
In the Monitor section of the global navigation menu, click Smart View.
-
From the Alerts drop-down, click Alerts Center.

The Alerts Center shows triggered alerts for your assets. The system delivers 99.9% of all system alert notifications within 60 seconds after collecting the alarm-able reading from a sensor in the data center. By default, the screen shows Active alerts for the Last 24 hours across all of your IBX data centers and accounts.
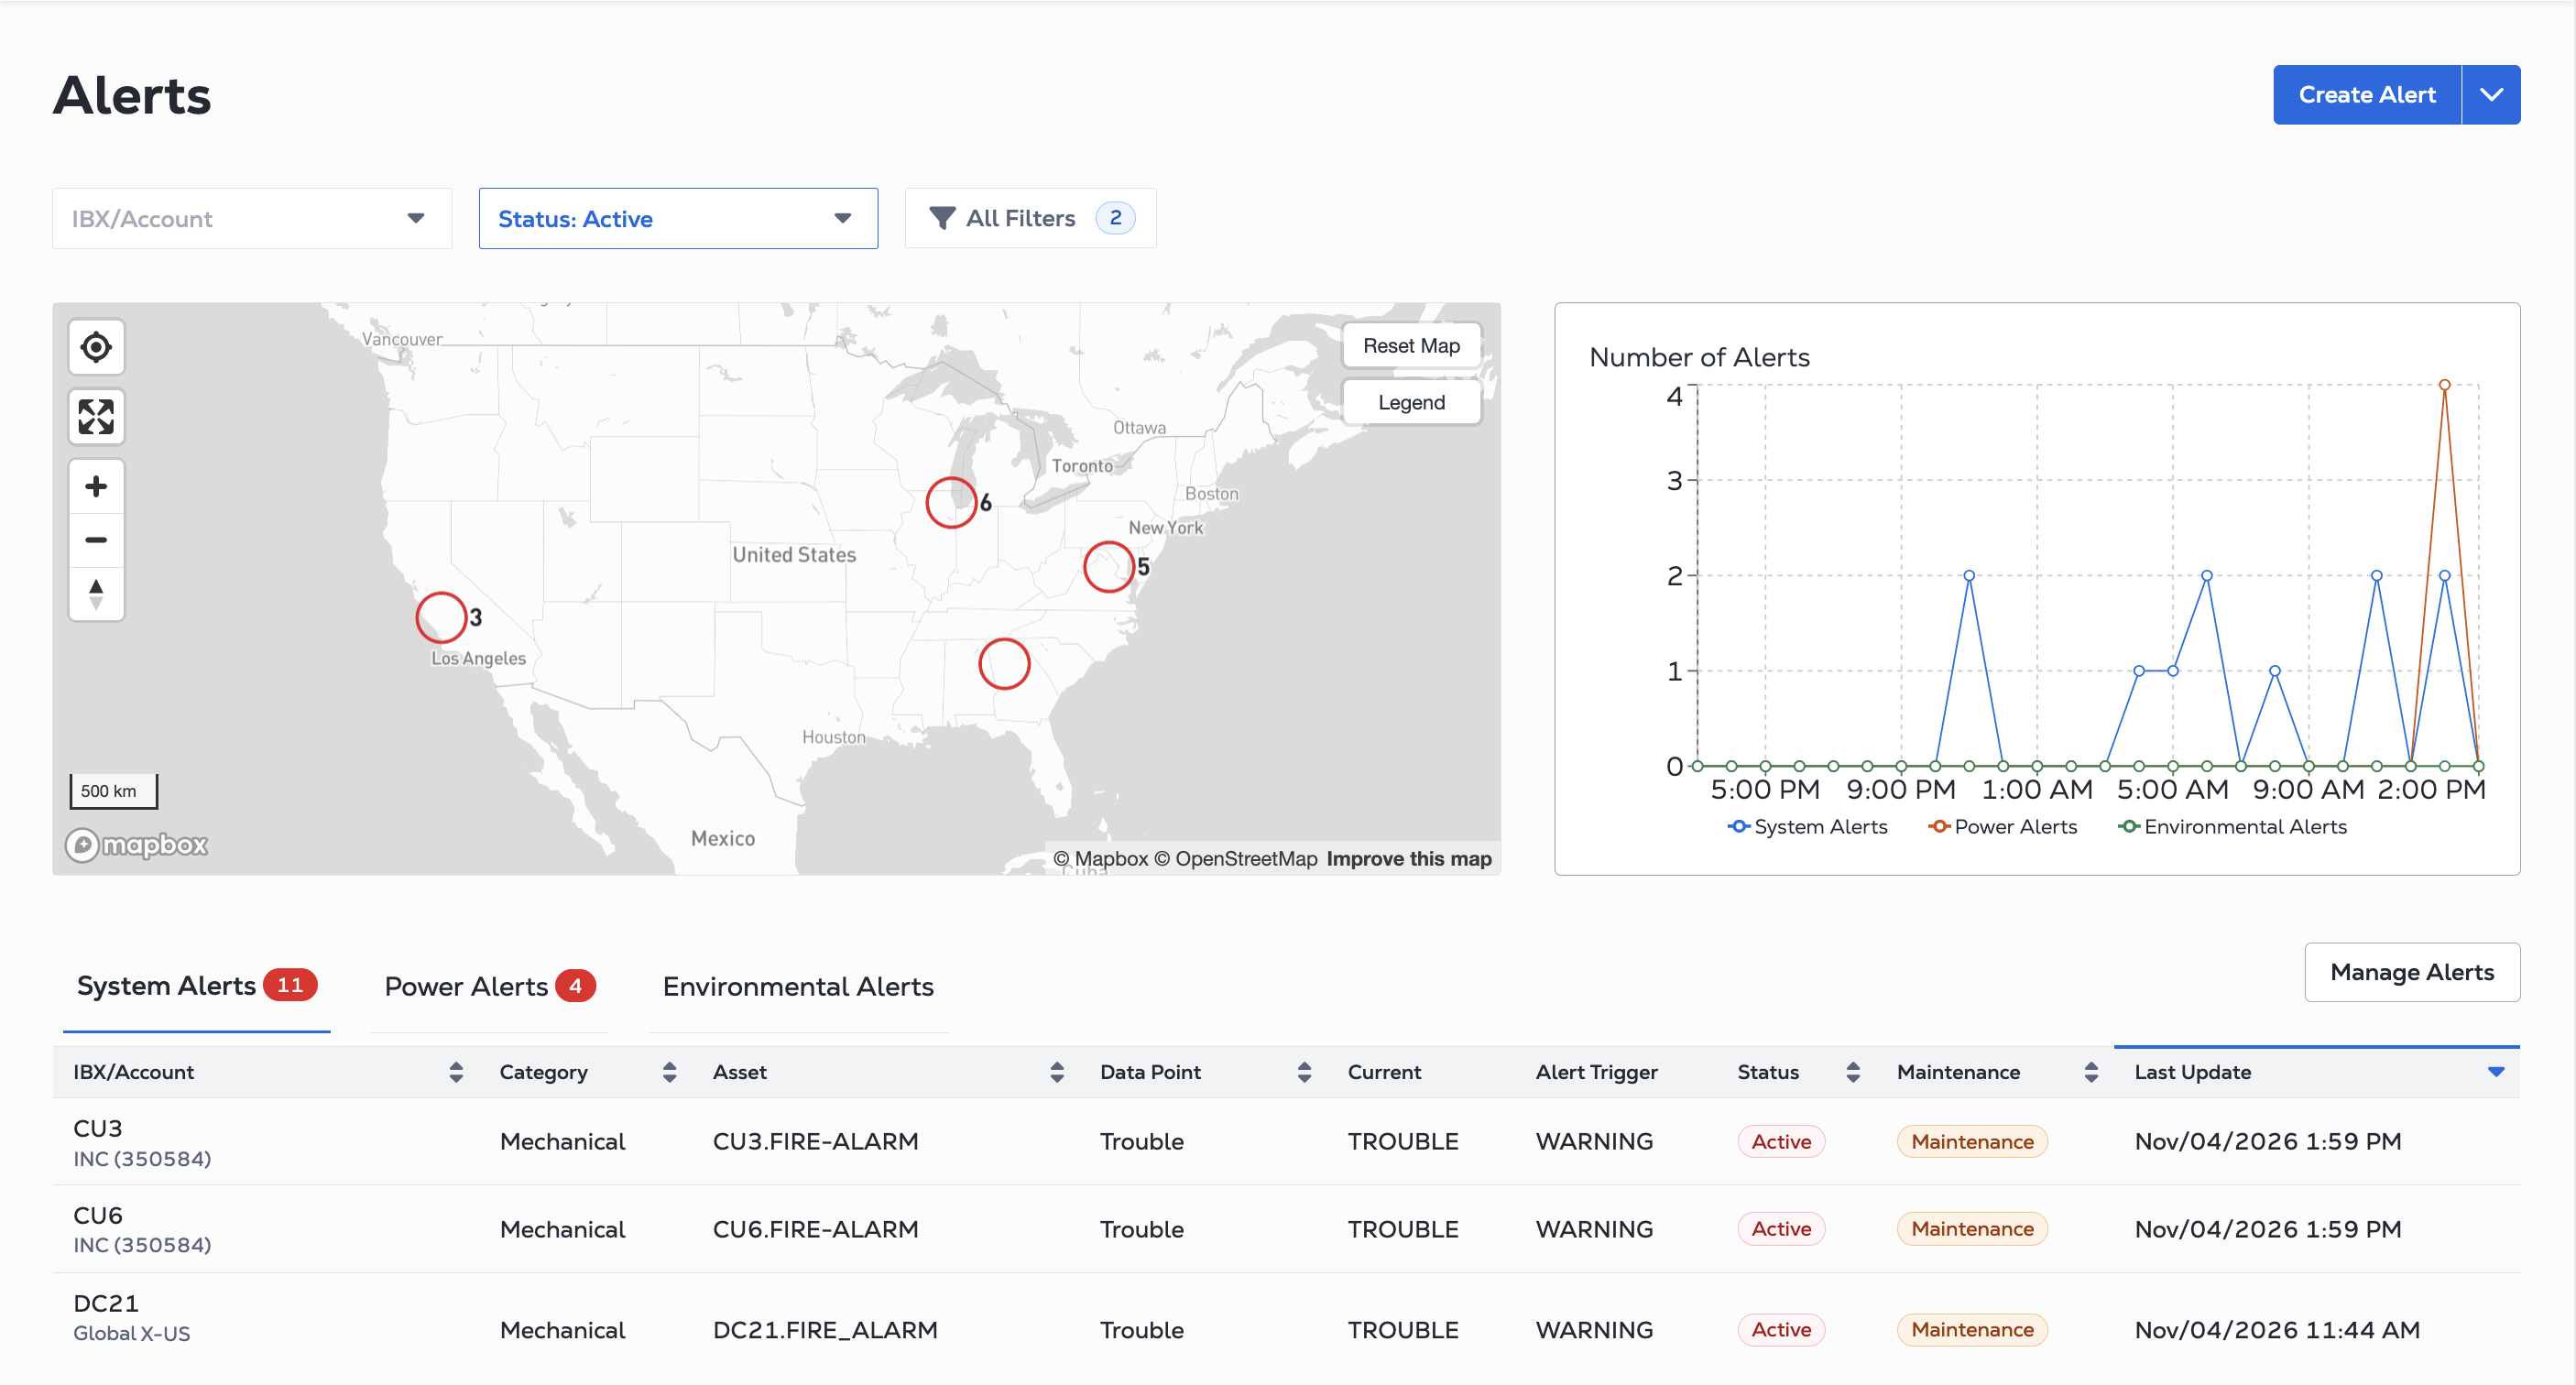
Use the controls above the map to filter what you see. The map, chart, tabs, and tables all update to match.
| Control | Description |
|---|---|
| IBX/Account | Show alerts for a specific IBX data center or account. |
| Status | Show Active alerts, Inactive (resolved) alerts, or both. |
| Time range | Choose the period to display (for example, Last 24 hours). |
| All Filters | Opens the filter drawer with all available filters: IBX/Location, Status, Time range, and System Alerts Category. The category filter applies only to System Alerts. |
| Reset | Clears all filters and returns to the default view. |
Map and Alert Chart
The map displays red circles at IBX locations with active alerts; the number inside is the count of active alerts. Hover over a circle to see the count by alert type. Click Reset Map to return to the default view. Click Legend to see what the symbols mean.
The Number of Alerts chart is a line chart of alert counts over the selected time range, with separate lines for System, Power, and Environmental alerts.
The Alerts Table
The Alerts Table has a tab for each type of Alert: System Alerts, Power Alerts, and Environmental Alerts. Click a tab to see that type of alert. The red badge on each tab shows its number of active alerts. The table shows 10 items per page by default; use the page controls at the bottom to change pages or the number of items per page.
Viewing Alert Details
Click an alert to see its details.
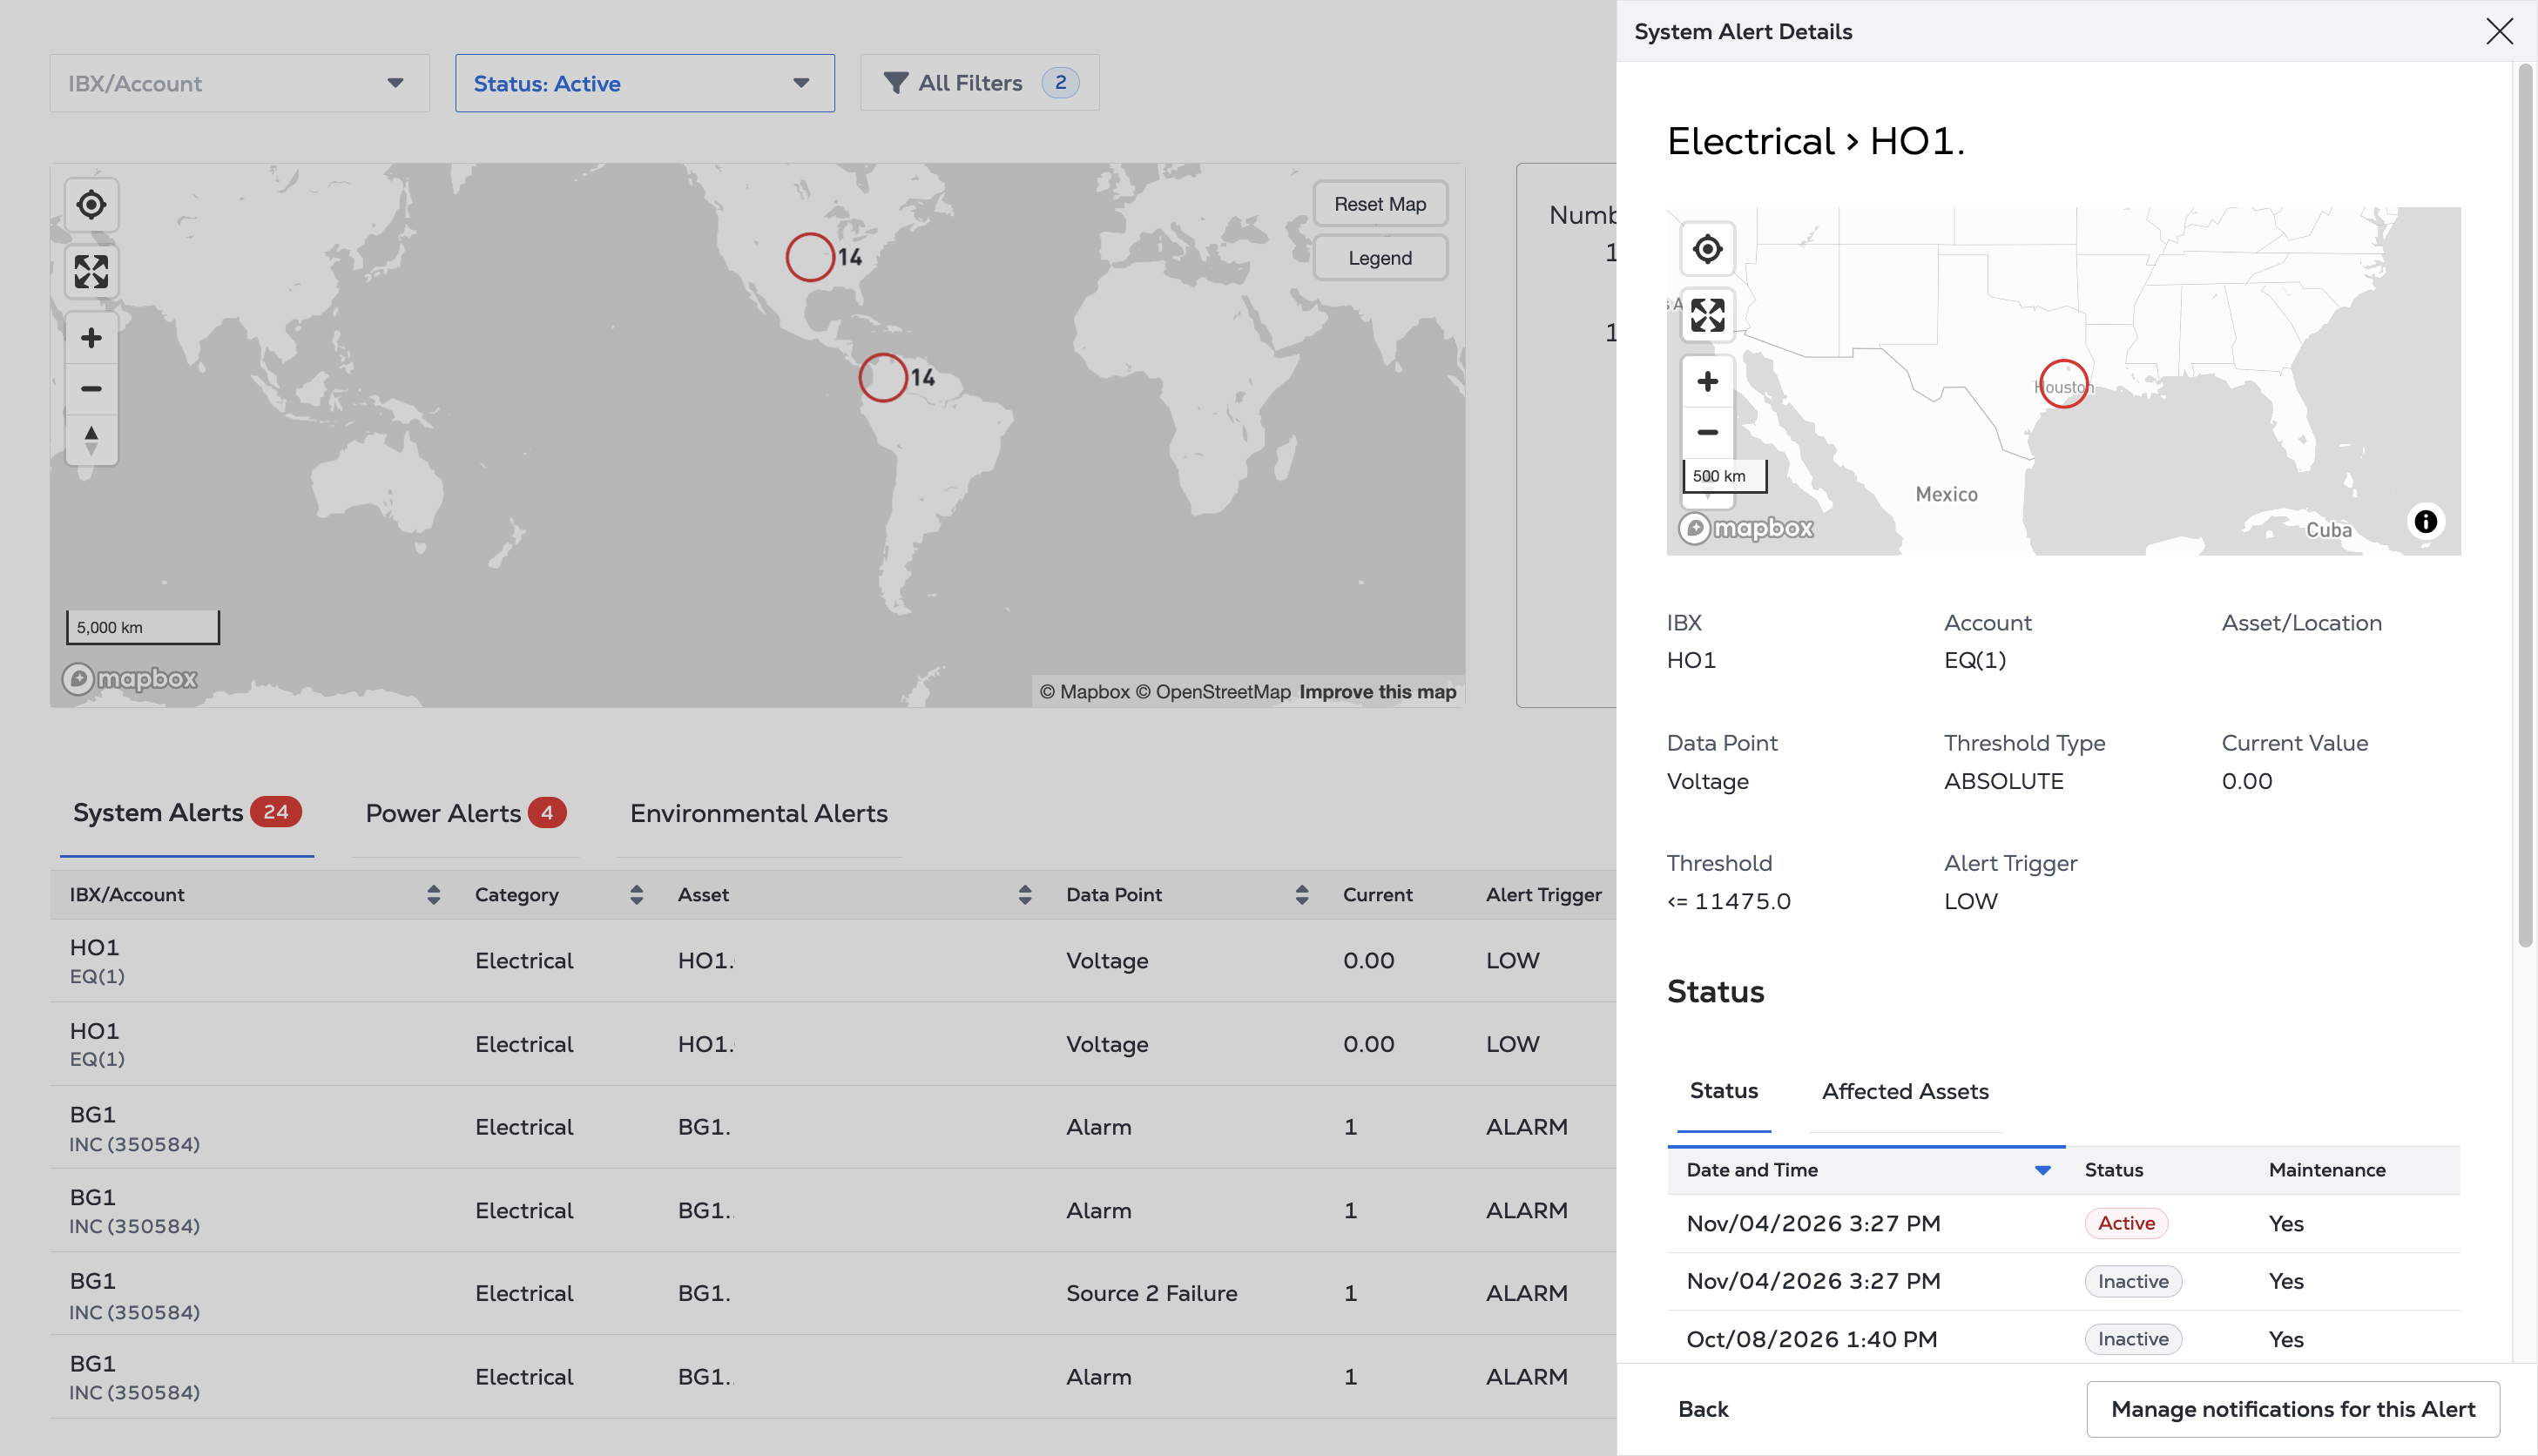
The System Alert Details contains:
-
The asset name and type, a map of the IBX location, and the IBX, account, asset/location, data point, threshold type, current value, threshold, and alert trigger.
-
Status The history of this alert on this asset for the last year. Inactive rows show when the system resolved the alert.
-
Affected Assets – The downstream assets affected by the alert, grouped by location.
If the alert is a System Alert, click Manage notifications for this Alert to change who is notified about this alert.
If the alert is a Power Alert or Environmental Alert, click Alert Settings to mange the alert and its notifications.
Click Back to return to the table.
Managing Alerts
To view and manage alert settings, click Manage Alerts.
From Alert Settings you can:
- Manage notifications for System Alerts.
- Create, edit, enable, disable, and delete your Power Alerts.
- Create, edit, enable, disable, and delete your Environmental alerts.
Smart View APIs
You can also retrieve alerts from the API using the /smartview/v2/systemAlerts/search endpoint.