Precision Time Inventory
The Precision Time Inventory lists all the Precision Time service instances that are included in a billing account, along with their provisioning status. If your Fabric account has been transitioned to the Equinix Identity and Access Management (IAM) platform, use the Context Switcher drop-down list to access your project and its assets.
To view Precision Time services, you need the EPT Service Admin role.
To access Precision Time service information in the API, you must submit your Client ID and Client Secret for OAuth2 authentication. Refer to API Authentication for instructions on how to call the OAuth API to validate and authenticate your credentials.
Service Inventory
- Portal
- API
-
Sign into the Customer portal.
-
From the Precision Time menu, click Service Inventory.
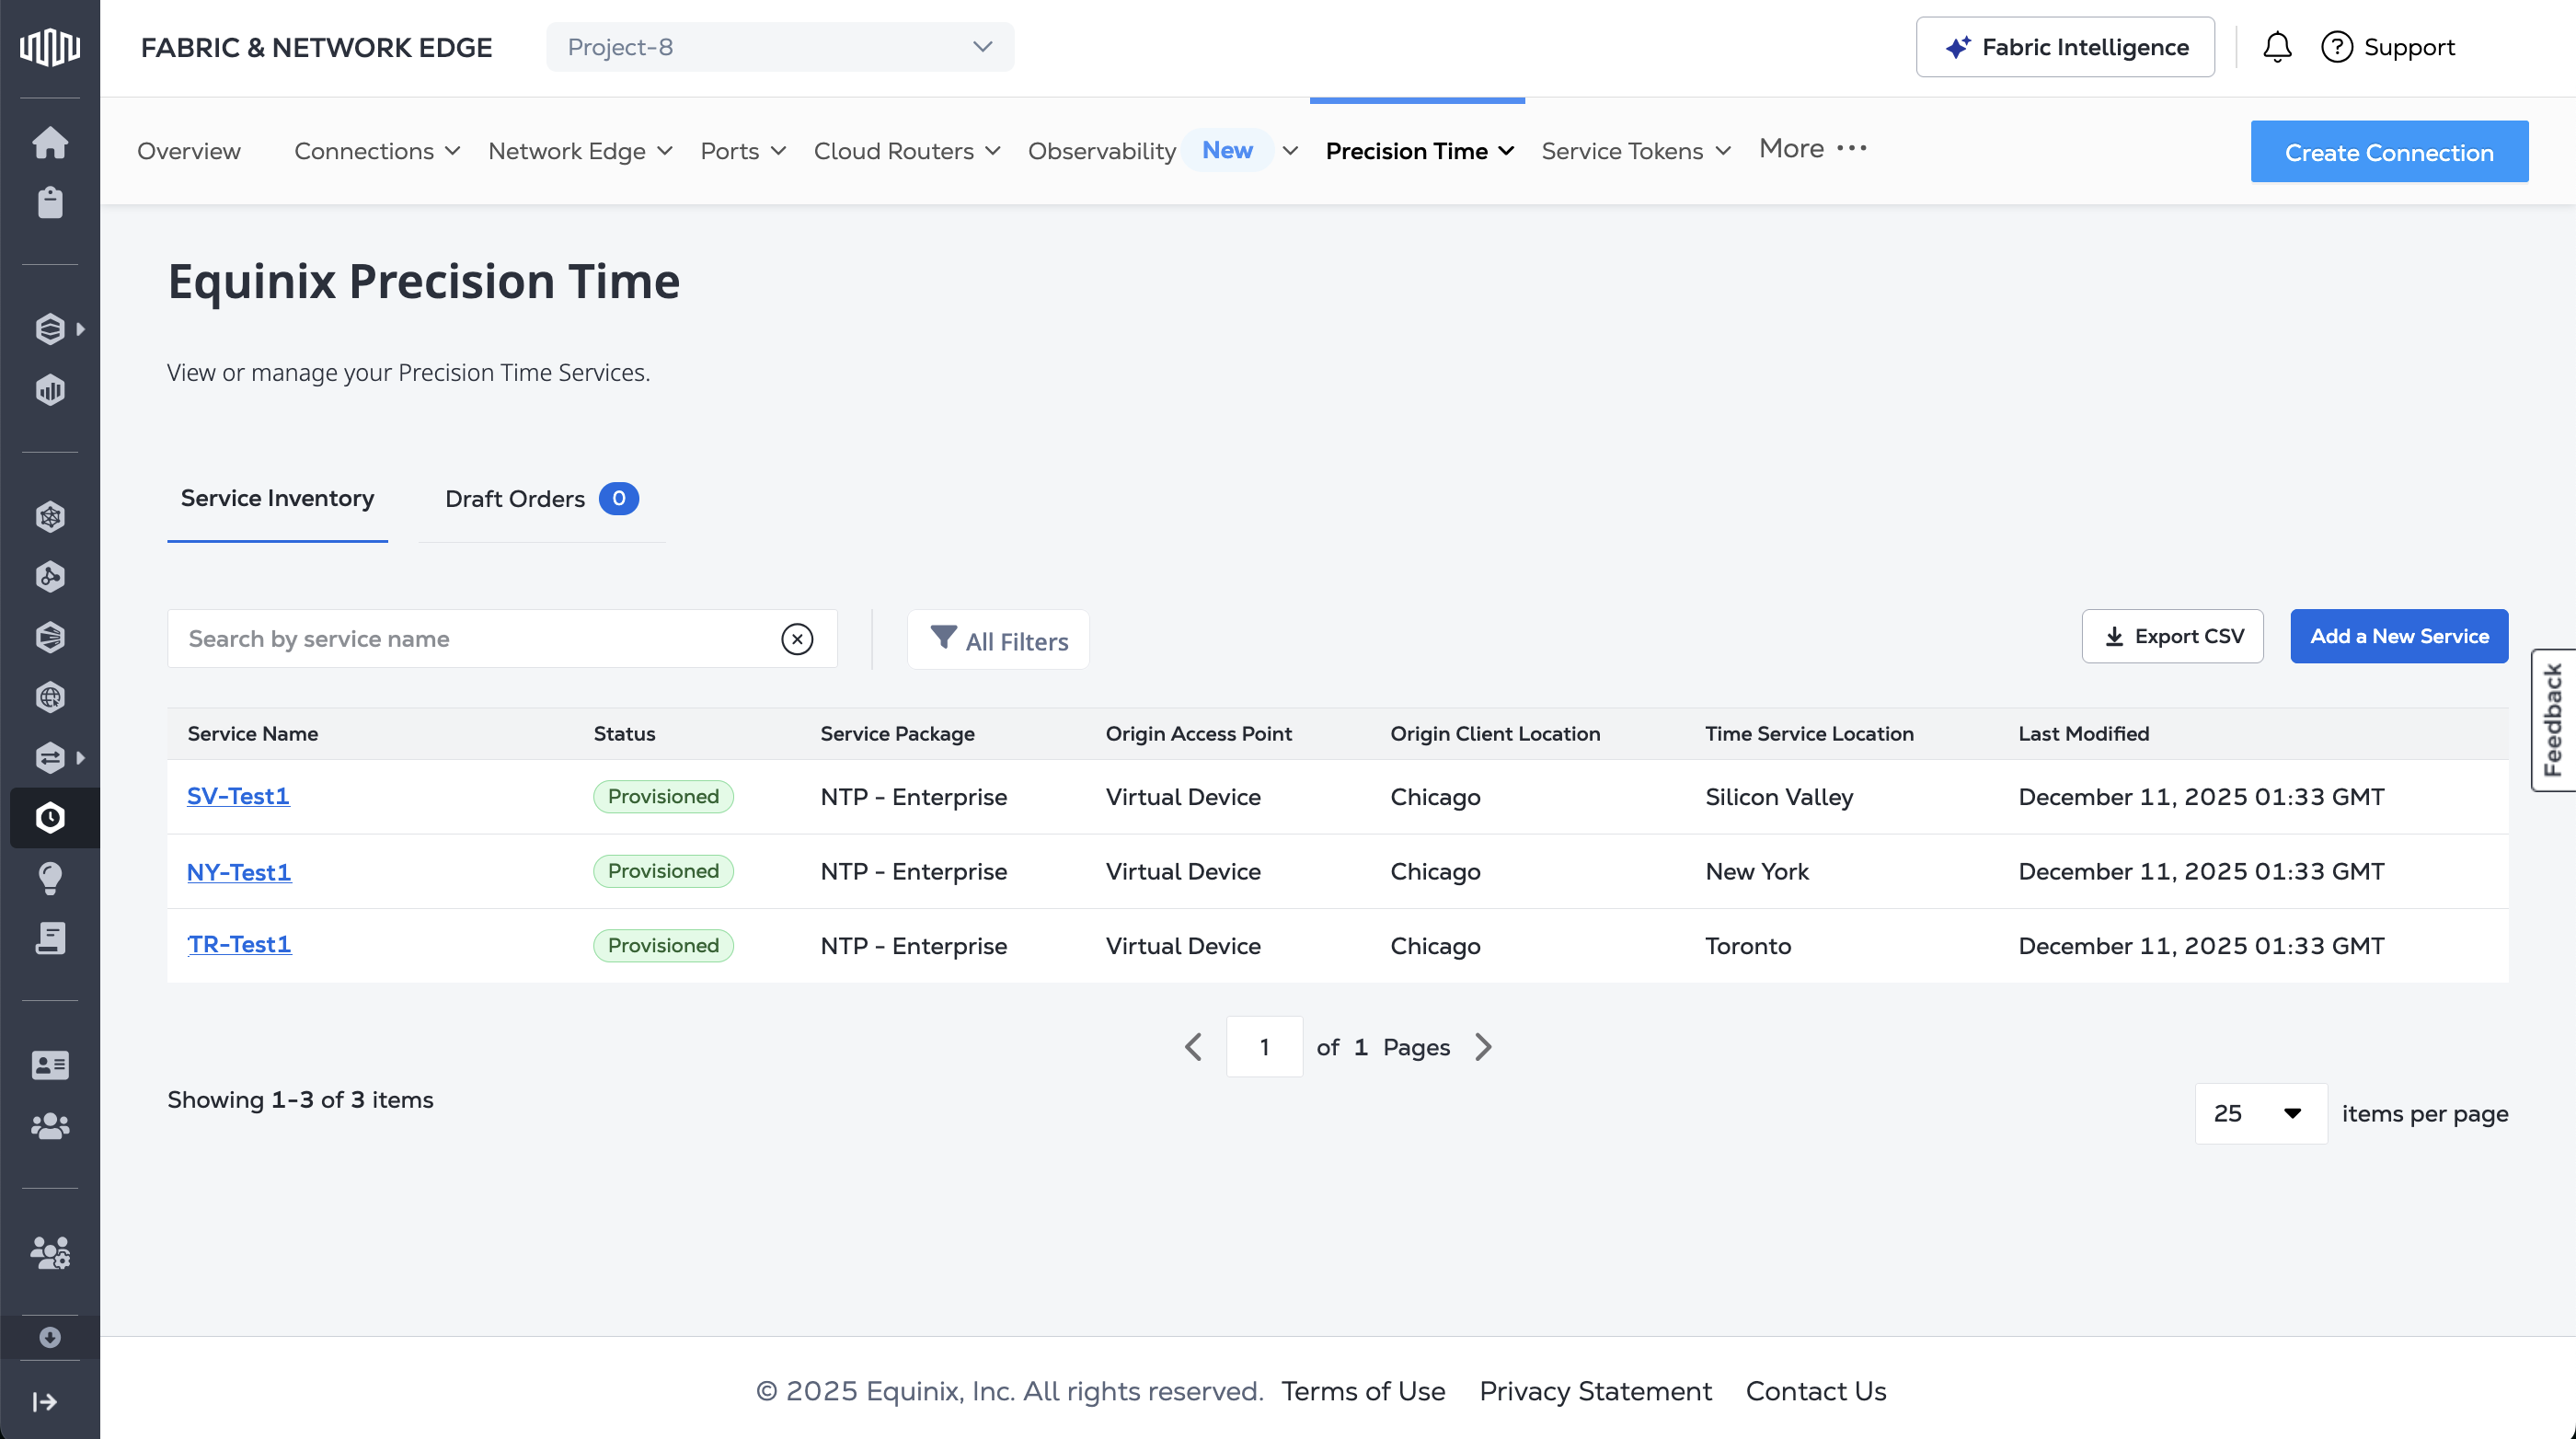
The table lists your Precision Time services, their status, package, origin access point, origin client location, the time service location, and the date the service was last modified. Click Export CSV to export the data to a downloadable .csv file.
To get a list of your Precision Time services, send a POST request to the /fabric/v4/timeServices/search endpoint. This endpoint also provides the ability to filter and sort the response. To see the list of services for a specific project, filter by project ID.
Sample cURL Request:
curl -X
POST 'https://api.equinix.com/fabric/v4/timeServices/search'
-H 'content-type: application/json'
-H 'authorization: Bearer <token>'
-d '{
  "filter": {
    "and": [
      {
        "property": "/project/projectId",
        "operator": "=",
        "values": [
          "<project_id>"
        ]
      }
    ]
  },
  "pagination": {
    "offset": 0,
    "limit": 20
  },
  "sort": [
    {
      "direction": "DESC",
      "property": "/changeLog/createdDateTime"
    }
  ]
}'
Service Details
- Portal
- API
In the Service Inventory, click a service name to access the details page.
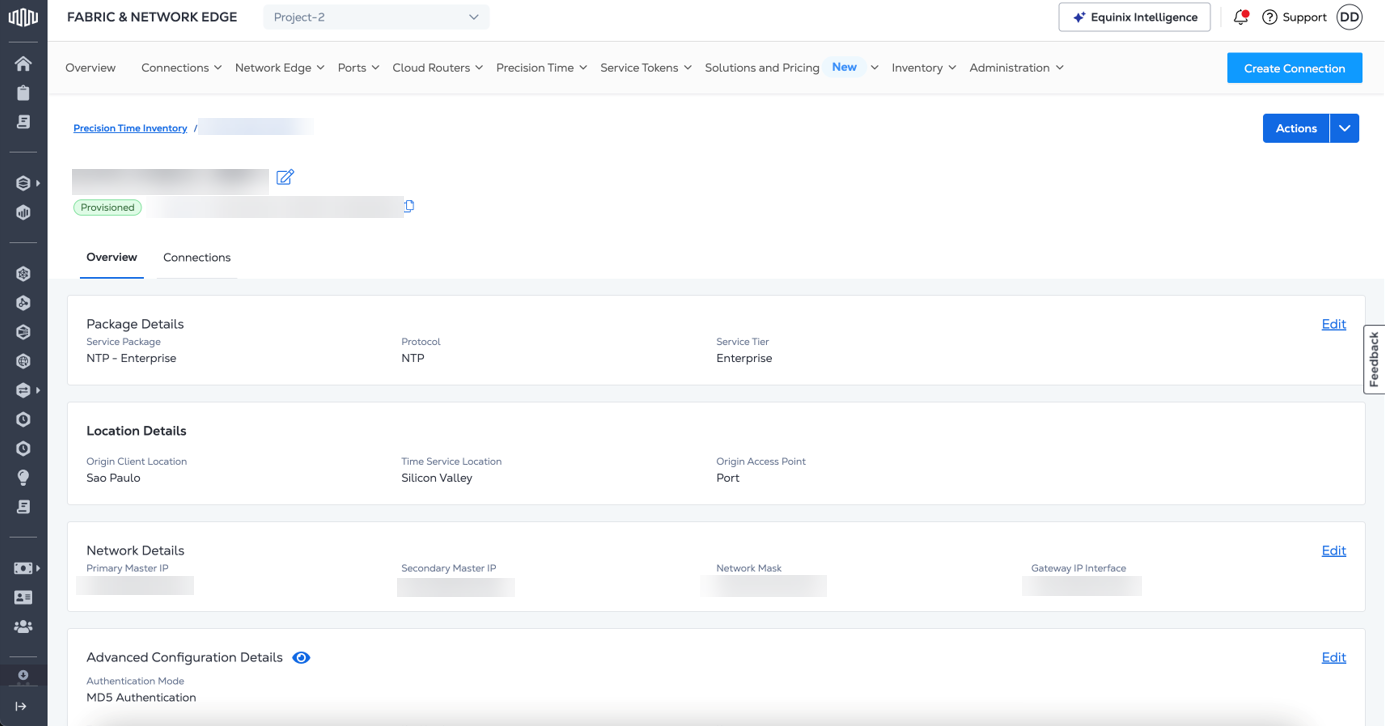
Service details include basic information about the service. You can also find details on the locations, the networking and connection settings, NTP or PTP advanced configuration details, and pricing.
To get the details of a Precision Time service, send a GET request to the /fabric/v4/timeServices/{serviceId} endpoint. Specify the ID of the service in the path of the request.
Sample cURL Request:
curl -X 'GET' 'https://api.equinix.com/fabric/v4/timeServices/<service_id>' \
-H 'accept: application/json' \
-H 'Authorization: Bearer <Bearer Token>'
Connections
- Portal
- API
The Connections tab displays the list of connections for the Fabric Cloud Router. The table includes the Connection name, access point, IBX, connection status, bandwidth, and UUID.
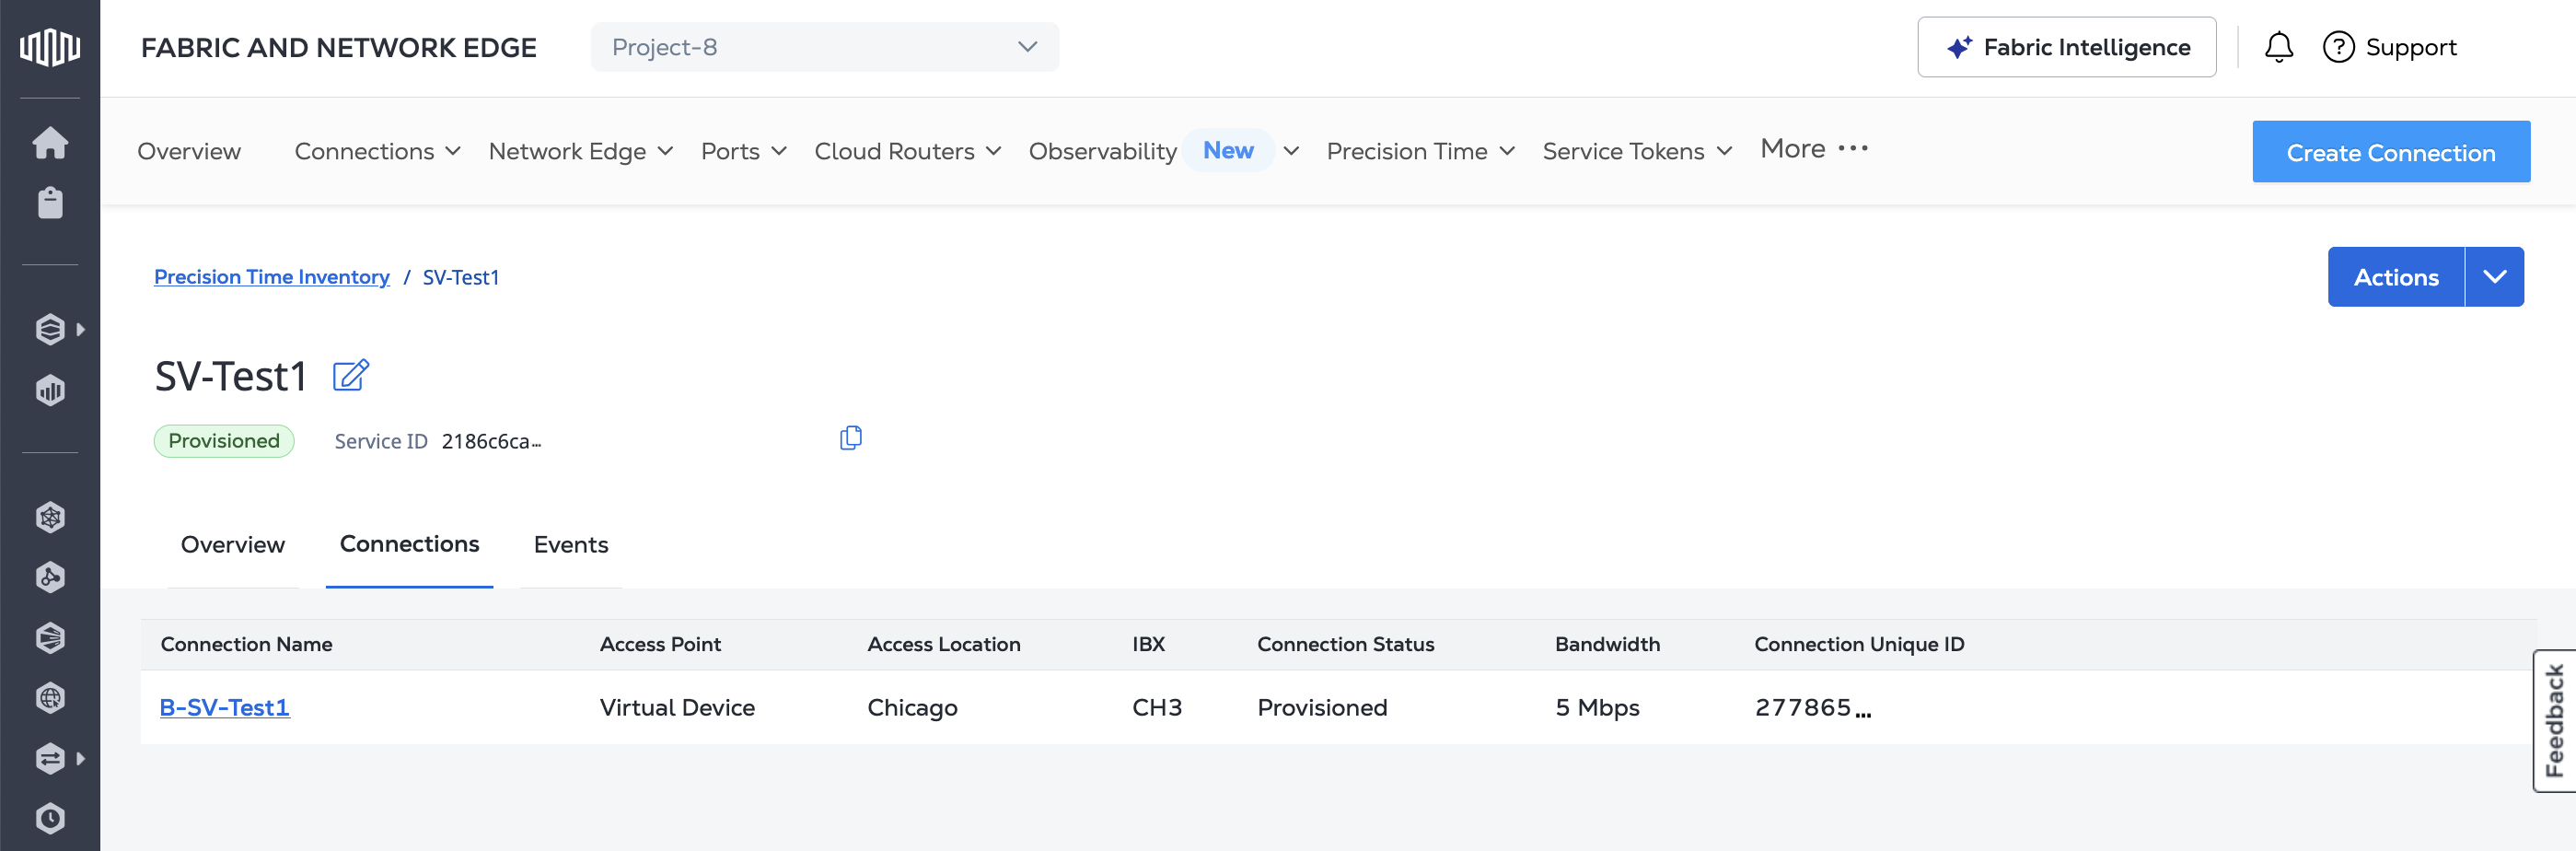
Click on a connection name to view the Connection Details page in the Connections Inventory.
To get the list of connections for a Precision Time service, send a GET request to the /fabric/v4/timeServices/{serviceId}/connections endpoint. Specify the ID of the service in the path of the request.
Sample cURL Request:
curl -X 'GET' 'https://api.equinix.com/fabric/v4/timeServices/<service_id>/connections' \
-H 'accept: application/json' \
-H 'Authorization: Bearer <Bearer Token>'
The Equinix API also offers the ability to create a stream for your Precision Time service's connection metrics so you can view the data from the Equinix API or create a subscription to have the data sent to your data collection platform.
To configure data collection from the API:
To get your data, either:
- Retrieve the data from the Metrics API endpoint](../observability/streaming-data/metrics.md#viewing-metrics-from-the-api).
- Create a subscription and send the data to a data collector.
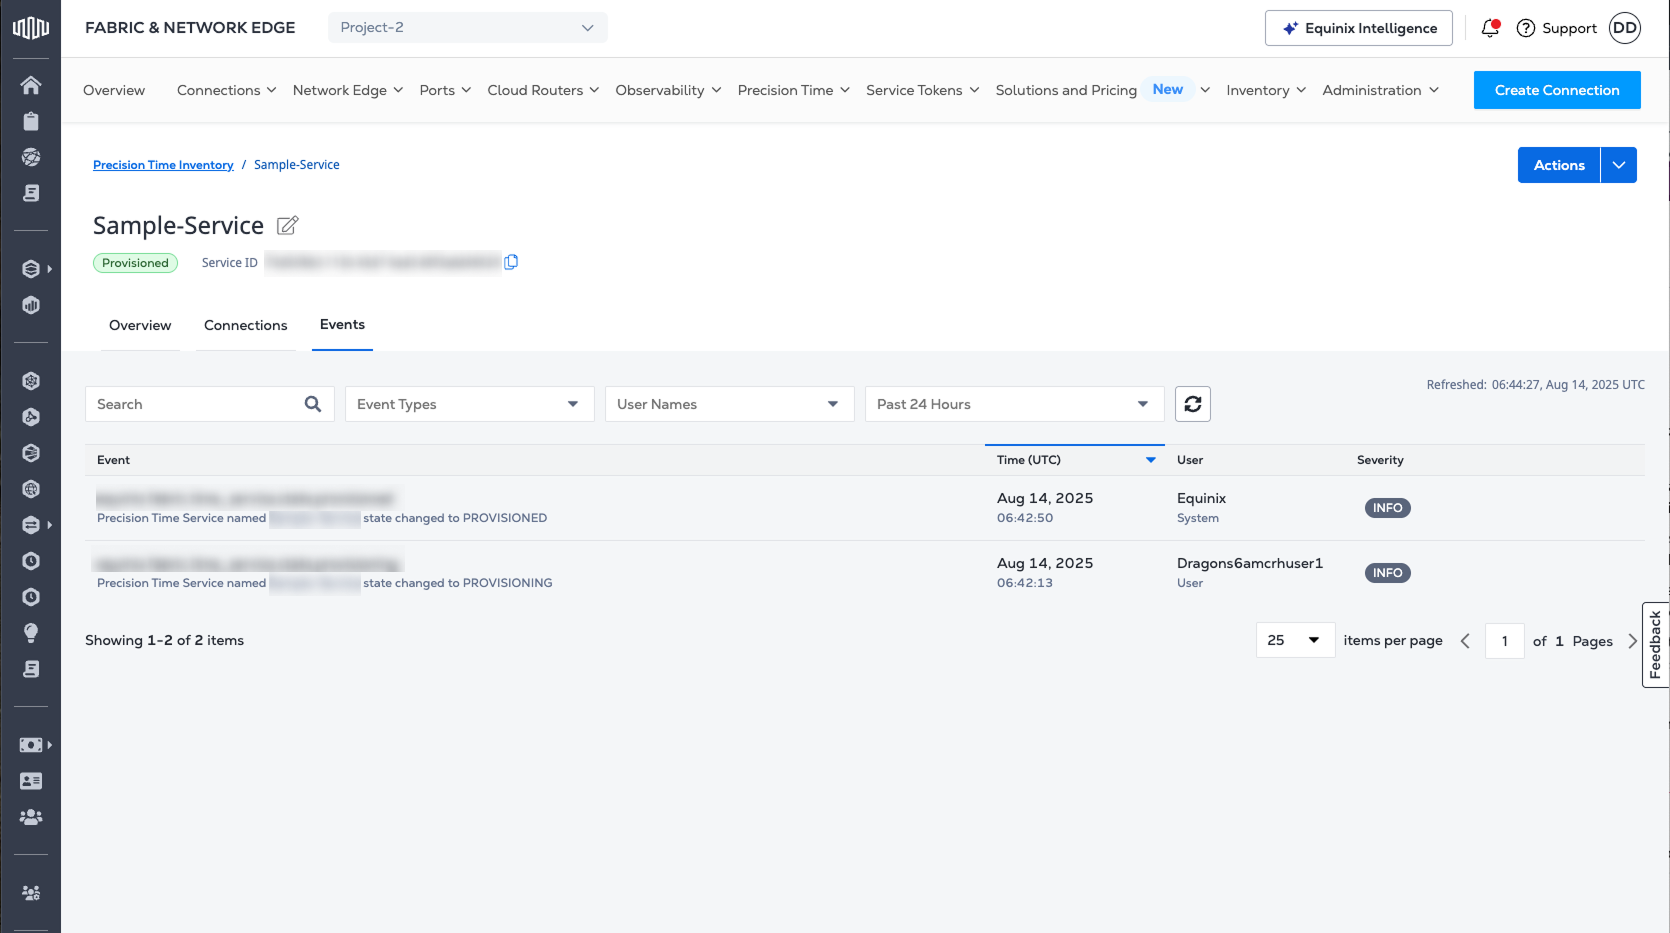
Viewing Event Logs
View or stream a comprehensive list of lifecycle events of the Precision Time service. The following event data is available:
equinix.fabric.time_service.state.cancelled
equinix.fabric.time_service.state.configured
equinix.fabric.time_service.state.configuring
equinix.fabric.time_service.state.configuring_failed
equinix.fabric.time_service.state.deprovisioned
equinix.fabric.time_service.state.deprovisioning
equinix.fabric.time_service.state.deprovisioning_failed
equinix.fabric.time_service.state.draft
equinix.fabric.time_service.state.provisioned
equinix.fabric.time_service.state.provisioning
equinix.fabric.time_service.state.provisioning_failed
Refer to the list of supported events.
- Portal
- API
To view lifecycle events for a Precision Time Service instance:
-
Navigate to the asset detail page.
-
Click the Events tab.
-
Select a time or date interval from the drop-down to filter events.
The Equinix API offers the ability to create a stream for your Precision Time service lifecycle events so you can view the data from the Equinix API or create a subscription to have the data sent to your data collection platform.
To configure data collection from the API:
To get your data, either:
- Retrieve the data from the Events API endpoint.
- Create a subscription and send the data to a data collector.