View Connection Traffic
Equinix Precision Time users can use the Customer portal to monitor the traffic statistics for their Fabric ports.
To view your traffic statistics:
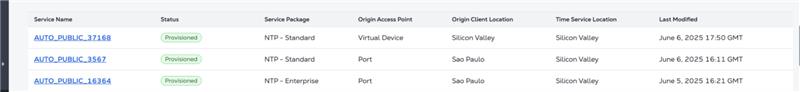
- In the Service Inventory click the service package link.
- Click the Connections tab.
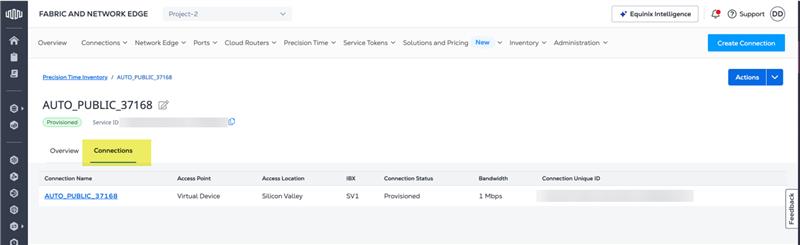
- Click a Connection link for the time service whose connections you want to monitor.
The time service must be connected through an Equinix Fabric port. No statistics are available for connections that originate from virtual devices.
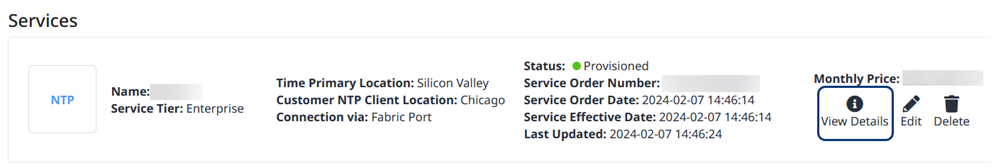
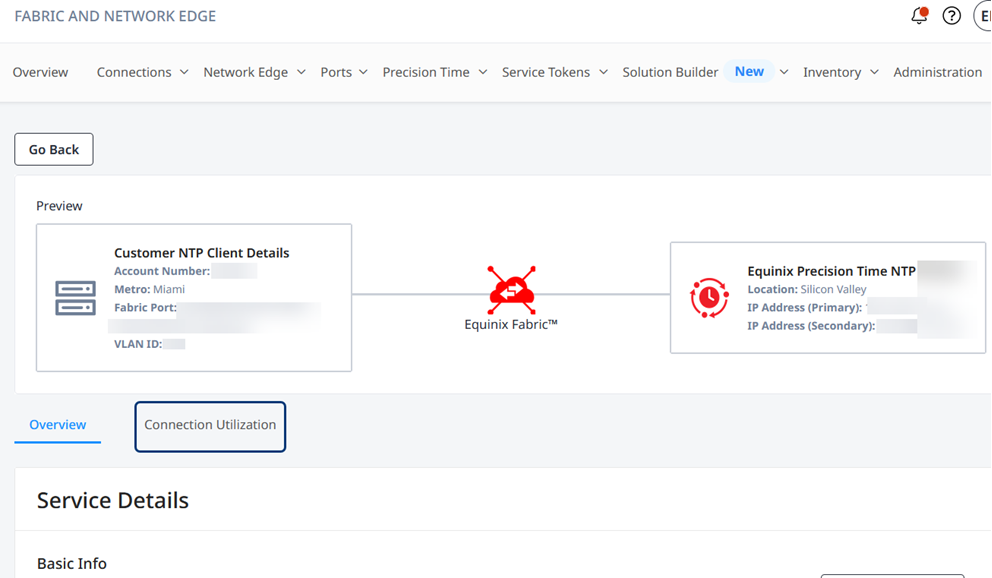
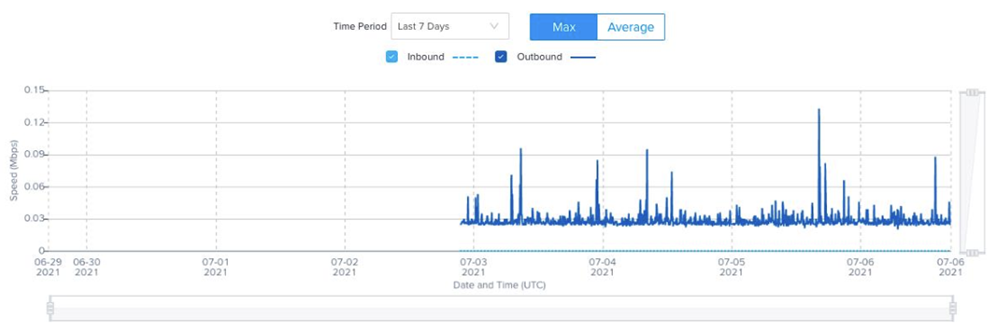
- Click the Connection Utilization tab to view the traffic statistics.
Graphs for inbound and outbound traffic are displayed. By default, the time period displayed is Last 7 Days. Also by default, the maximum utilization statistics are displayed.
You can change the time period using the Time Period drop-down list. The minimum is Last 24 Hours and the maximum is Last 3 Months.
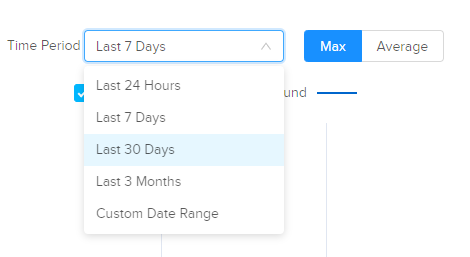
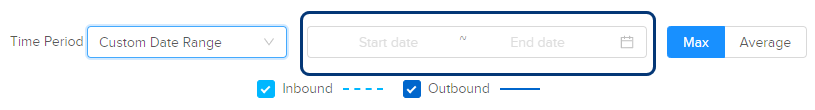
Select Custom Date Range to enter specific dates and view the traffic during that period.
Click Average to view the average utilization statistics.

Below the graph, the utilization data for the selected time period is displayed:
- Last Polled – Indicates the time and date the data was last polled, as well as inbound and outbound utilization.
- Average – Indicates the daily average inbound and outbound utilization for the selected time period.
- Maximum – Indicates the maximum inbound and outbound utilization for the selected time period.
To return to the Services summary, click Go Back in the upper left corner of the page.