Smart View Environmental Reports
Environmental Reports in the Customer Portal provide visibility into the environmental impact of your IBX data center deployments. Use these reports to support sustainability goals, meet compliance requirements, and track energy-related metrics across your colocation footprint.
Request an Environmental Report
-
Sign in to the Customer Portal.
-
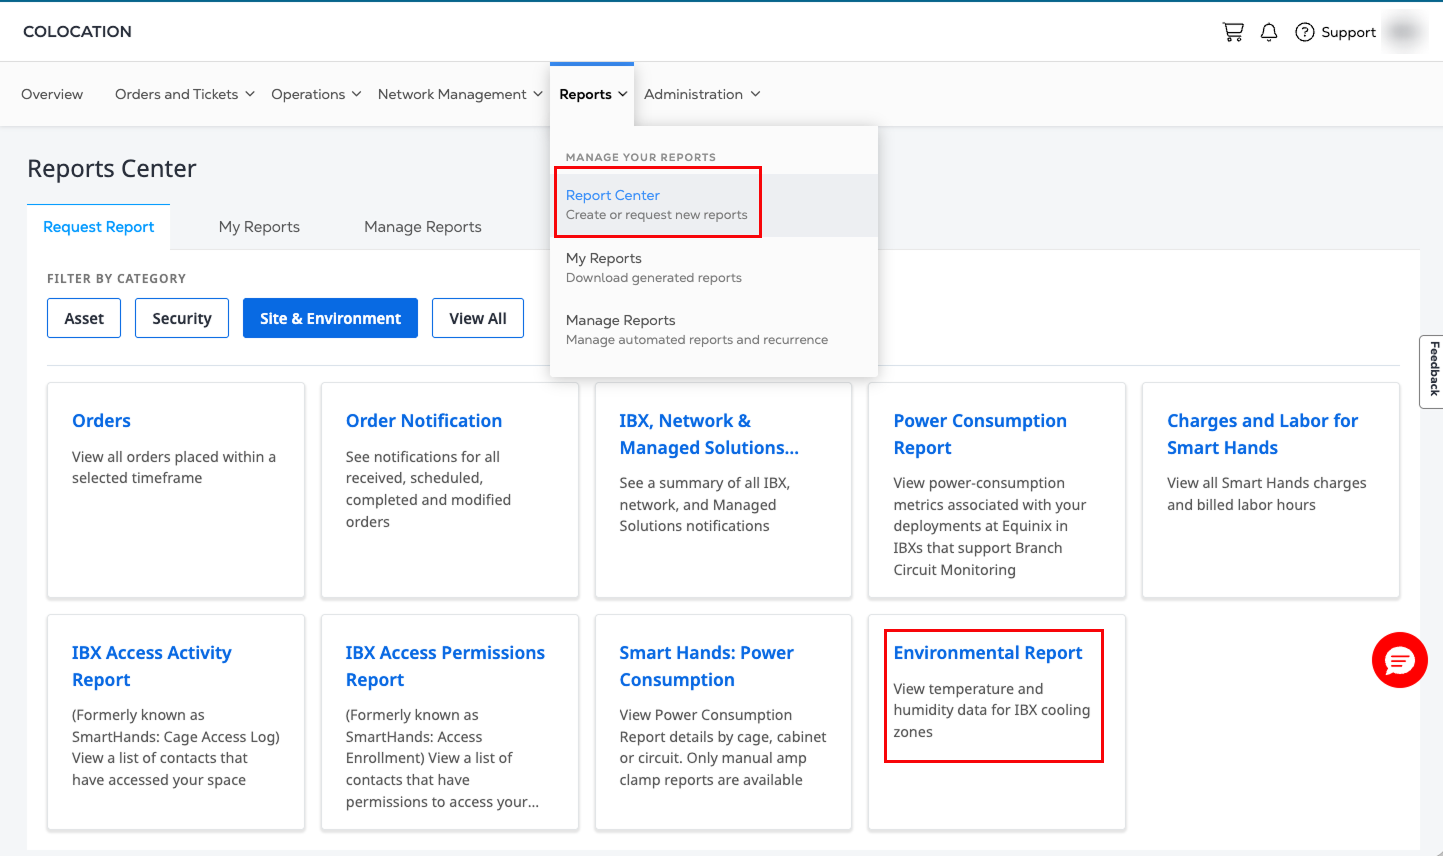
Select Reports from the main navigation, followed by Report Center.
-
Under Request Report, select Environmental Report.
-
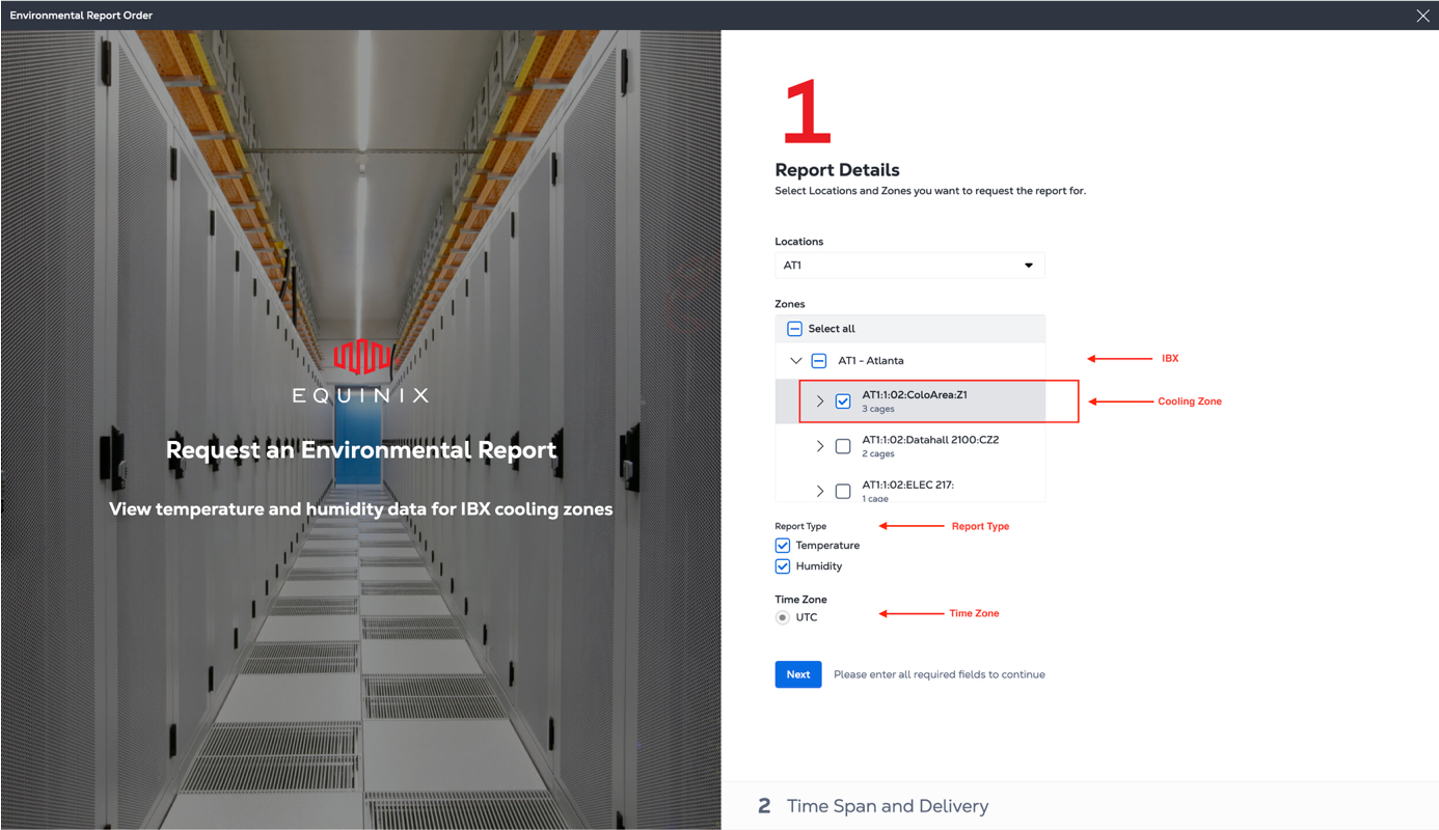
Select the IBX locations, cooling zones in the IBX, and report type (Temperature, Humidity) to include in the report. The default time zone is UTC.
 note
noteThe data shown in the Environmental Report represents the cooling zone level condition. A cooling zone is a defined area within an IBX data hall that shares a common airflow and cooling configuration. Each zone typically contains:
- A group of cabinets served by the same cooling units
- A consistent cold aisle/hot aisle arrangement
- A set of environmental sensors (temperature and humidity), installed throughout the space.
Cooling zones are used to monitor operational conditions more granularly than facility-wide (IBX level) measurements. They provide enhanced visibility into their local thermal environment without affecting the formal SLA measurement location. The Environmental Report is generated from the mean temperature and humidity of all environmental sensors inside a cooling zone.
-
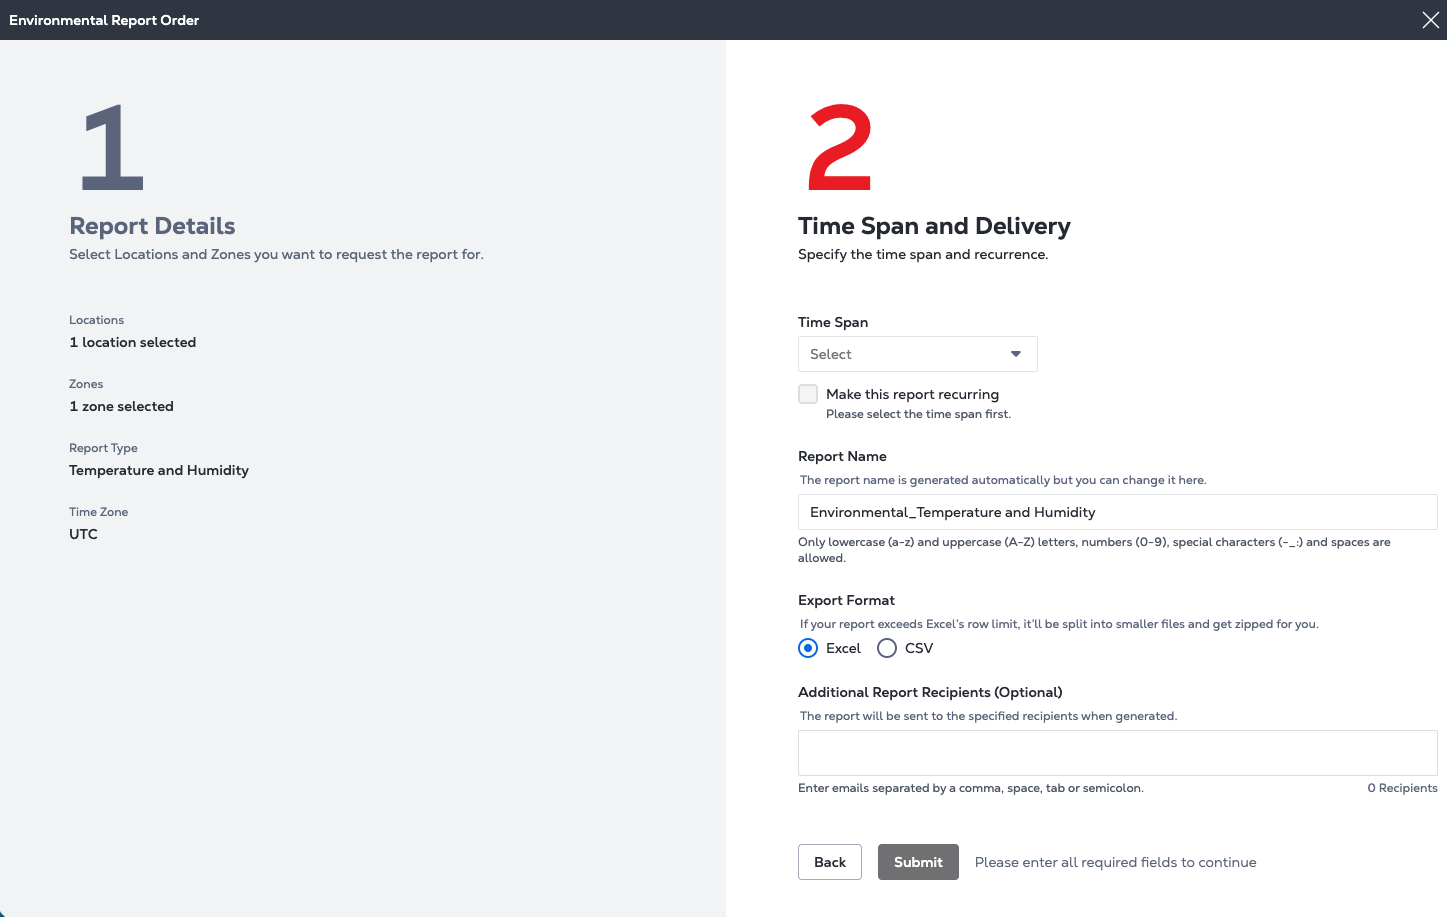
Select a delivery frequency for the report.
- Yesterday
- Past 30 days
- Last Month
- Last Quarter
- Last Year
- Or choose a custom date range. You can select dates from up to the past three years, but each range can span only one year.
If you choose Yesterday, Last Month, Last Quarter, or Last Year, you have the option to select Make this report recurring.
-
Enter a name for the report, or keep the default name.
-
Select a report format: Excel or Comma-Separated Values (CSV).
-
Enter the email addresses of any additional report recipients.
-
Click Submit.
Manage Reports
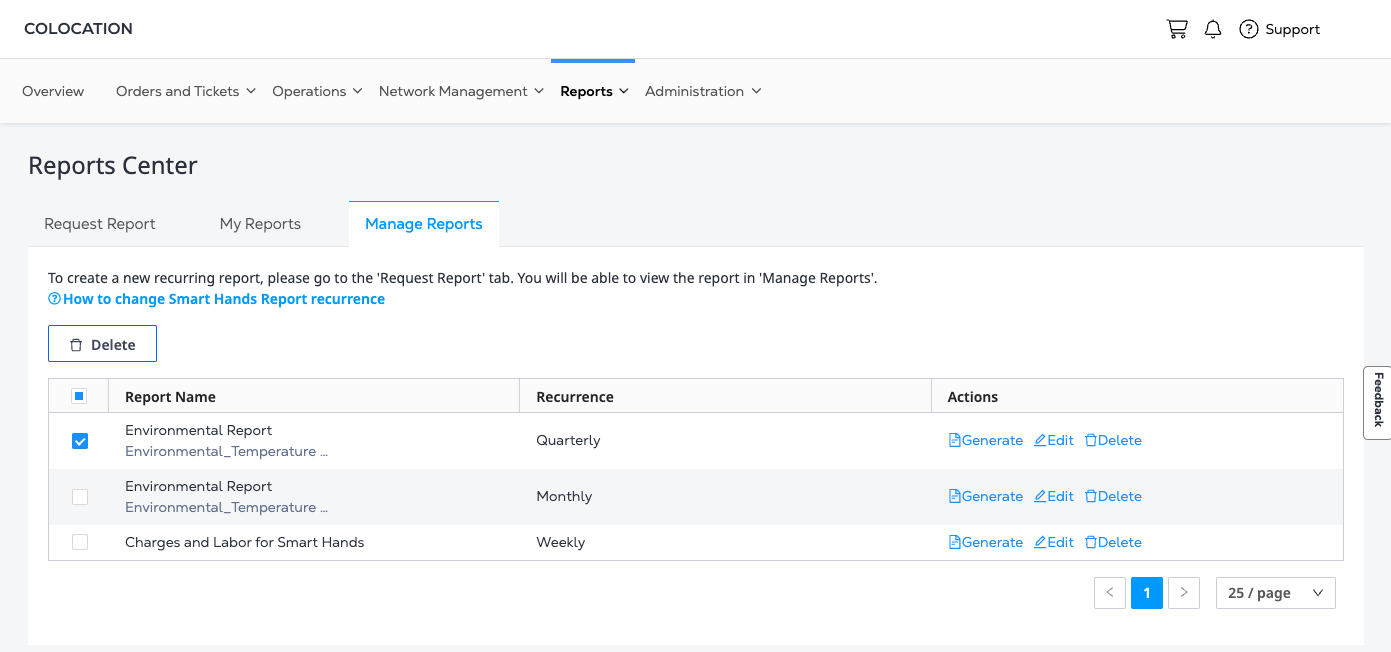
To download and view the report, click the Manage Reports tab. The new report is shown at the top of the reports list.
Environmental Report Column Definitions
The data shown in the Environmental Report is aggregated to the selected Cooling Zone level. Each row in the output report represents one day's data aggregated to the Cooling Zone level.
Temperature and humidity data
This dataset contains time-series environmental measurements for each IBX zone.
| Column name | Definition |
|---|---|
| Date | Excel serial date representing the measurement date (e.g., 46104 = 2026-03-24). |
| Time Zone | The time zone used for the timestamp (e.g., UTC). |
| IBX | The data center identifier (e.g., AT1). |
| Zone | The specific location within the IBX where sensors are installed (format: IBX:Floor:Room:Area:Zone). Example: AT1:1:O2:ColoArea:Z1. |
| Temperature (°C) – Mean | Average temperature recorded from all sensors mapped to the Zone for the sampling period, measured in Celsius. |
| Temperature (°C) – Min | Average of minimum temperature recorded from all sensors mapped to the Zone in the period. |
| Temperature (°C) – Max | Average of maximum temperature recorded from all sensors mapped to the Zone in the period. |
| Humidity (%) – Mean | Average relative humidity recorded from all sensors mapped to the Zone for the sampling period. |
| Humidity (%) – Min | Average of lowest humidity recorded from all sensors mapped to the Zone in the period. |
| Humidity (%) – Max | Average of highest humidity recorded from all sensors mapped to the Zone in the period. |
Zone cage mapping
| Column name | Definition |
|---|---|
| IBX | Data center identifier (e.g., AT1). |
| Zone | The environmental zone ID within the IBX (same structure as Sheet 1). |
| Cage | The Cage IDs mapped to that zone. A zone can have multiple cages (examples: AT1:02:020900, AT1:02:020956, AT1:02:FE00ATT). |