Event Streams
!!! Info "Notice"
Equinix Metal Observability features are currently in Beta and not available to all customers. This is intended for evaluation and testing only. This feature is currently non-billed and not covered by an SLA.
You can monitor specific event and activity data from your Metal organizations in near real-time using event streams. Event streams can provide critical event data to help you understand and analyze your business needs. These events include:
- Account and Organization Events
- Services and Billing events
- Device Management Events
- Networking Management Events
Event Streams are only visible to Owners and Admins for an Organization.
Limitations
Currently, event streams supports only Splunk as the destination. Observability Stream data is sent to Splunk through the Splunk HTTP Event Collector ("HEC") interface. In order to receive Observability Stream data, you must first configure an HTTP Event Collector in your Splunk instance. We recommend creating a dedicated collector specifically for receiving Observability Stream data.
Sending Observability Stream data to Splunk is subject to the following limitations:
- To ensure encryption of data in transit, only HTTPS connections are allowed. Sending data to a Splunk HEC using plain, unsecured HTTP is NOT supported.
- All Observability Stream data is sent to Splunk as JSON events; raw data is NOT supported.
- JSON events will be sent to the standard
/services/collector/eventendpoint; alternative endpoint URLs are NOT supported. - JSON events will be sent to the default index that was configured when creating the Splunk HTTP Event Collector. Overriding the index of events sent to Splunk is NOT supported.
- Indexer acknowledgement is NOT supported.
The Observability API
If you are using the Observability API, you should note some differences between it and the current Equinix Metal API.
- new API endpoints
- new Authentication mechanism
First, Observability has its own API endpoints that can be reached at https://observability.equinixmetal.net.
Second, the Observability API has a authentication mechanism where you exchange your Equinix Metal API key for a short-lived JSON web token (JWT) that you use for authentication for all observability requests. The token expires after 5 minutes. To retrieve a JWT, send a POST request to the iam.metalctrl.io/api-keys/exchange endpoint.
curl -X POST \
-H "Authorization: bearer <API_TOKEN>" \
https://iam.metalctrl.io/api-keys/exchange
The response will be a JSON "access_token" which you use to authenticate your requests to the Observability API.
{
"access_token": "eyJ....98"
}
The Observability API does not accept Equinix Metal API keys for authentication.
Creating an Event Stream
- Console
- API
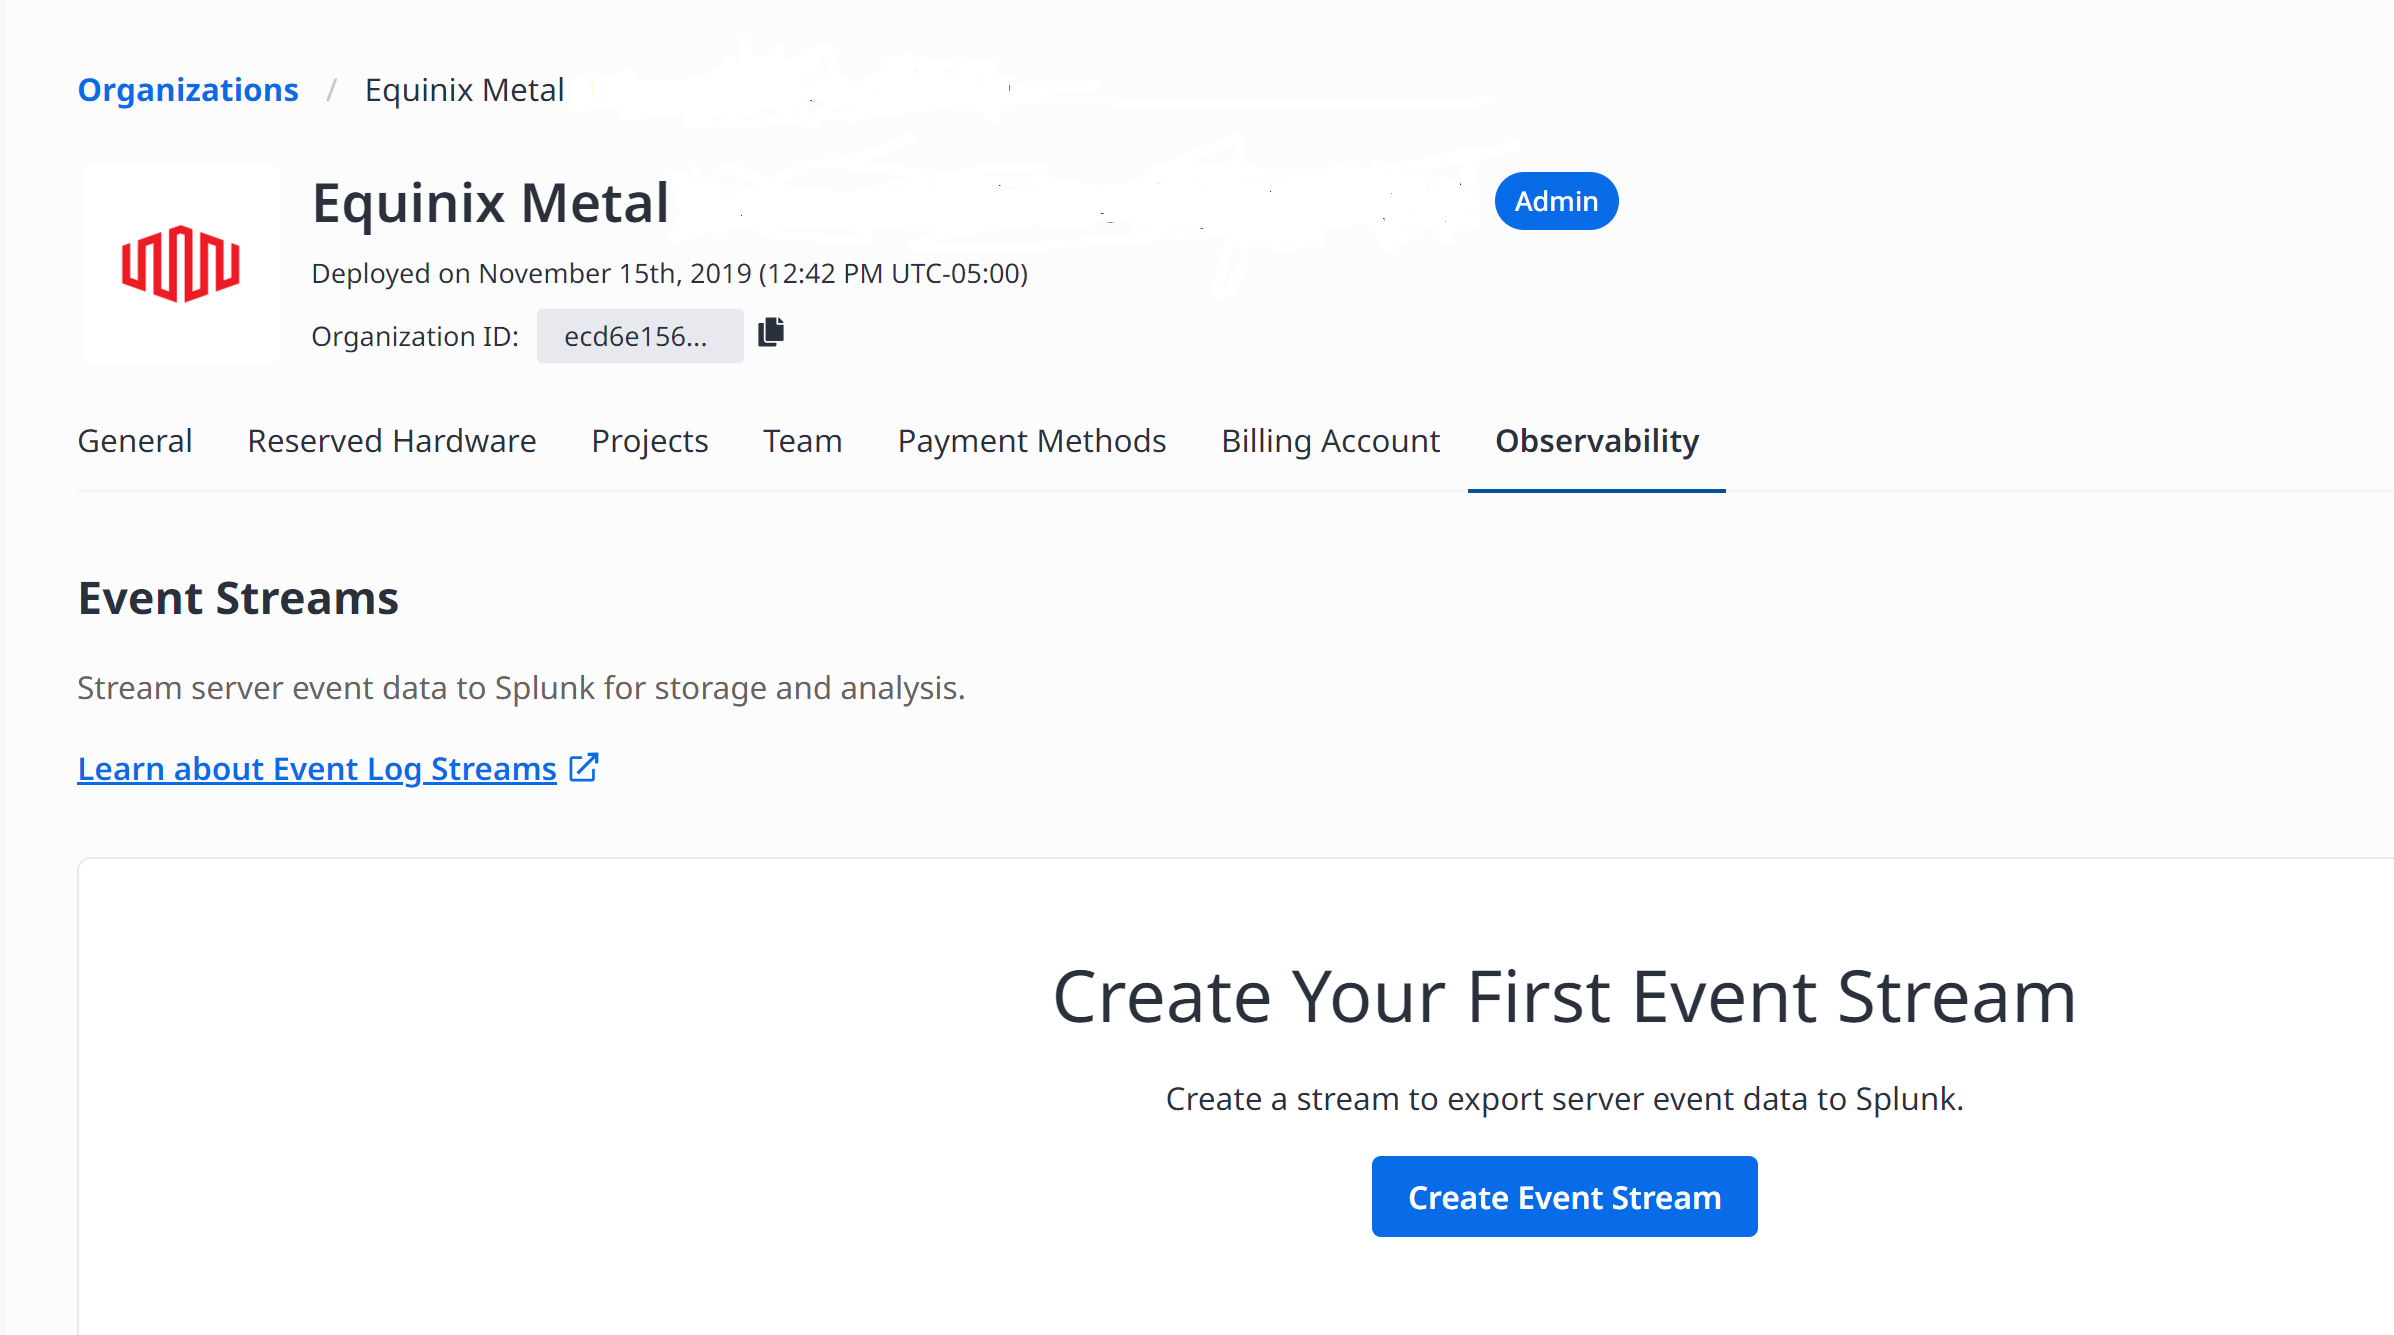
Create an event stream to export server data to Splunk for storage and analysis. To create a stream, do the following:
-
Go to Equinix Metal Portal and enter your credentials to sign in to the portal.
-
From the Organization's drop-down menu, select the organization to create an event stream.
-
Click the Observability tab.
-
Click, Create Event Stream.
-
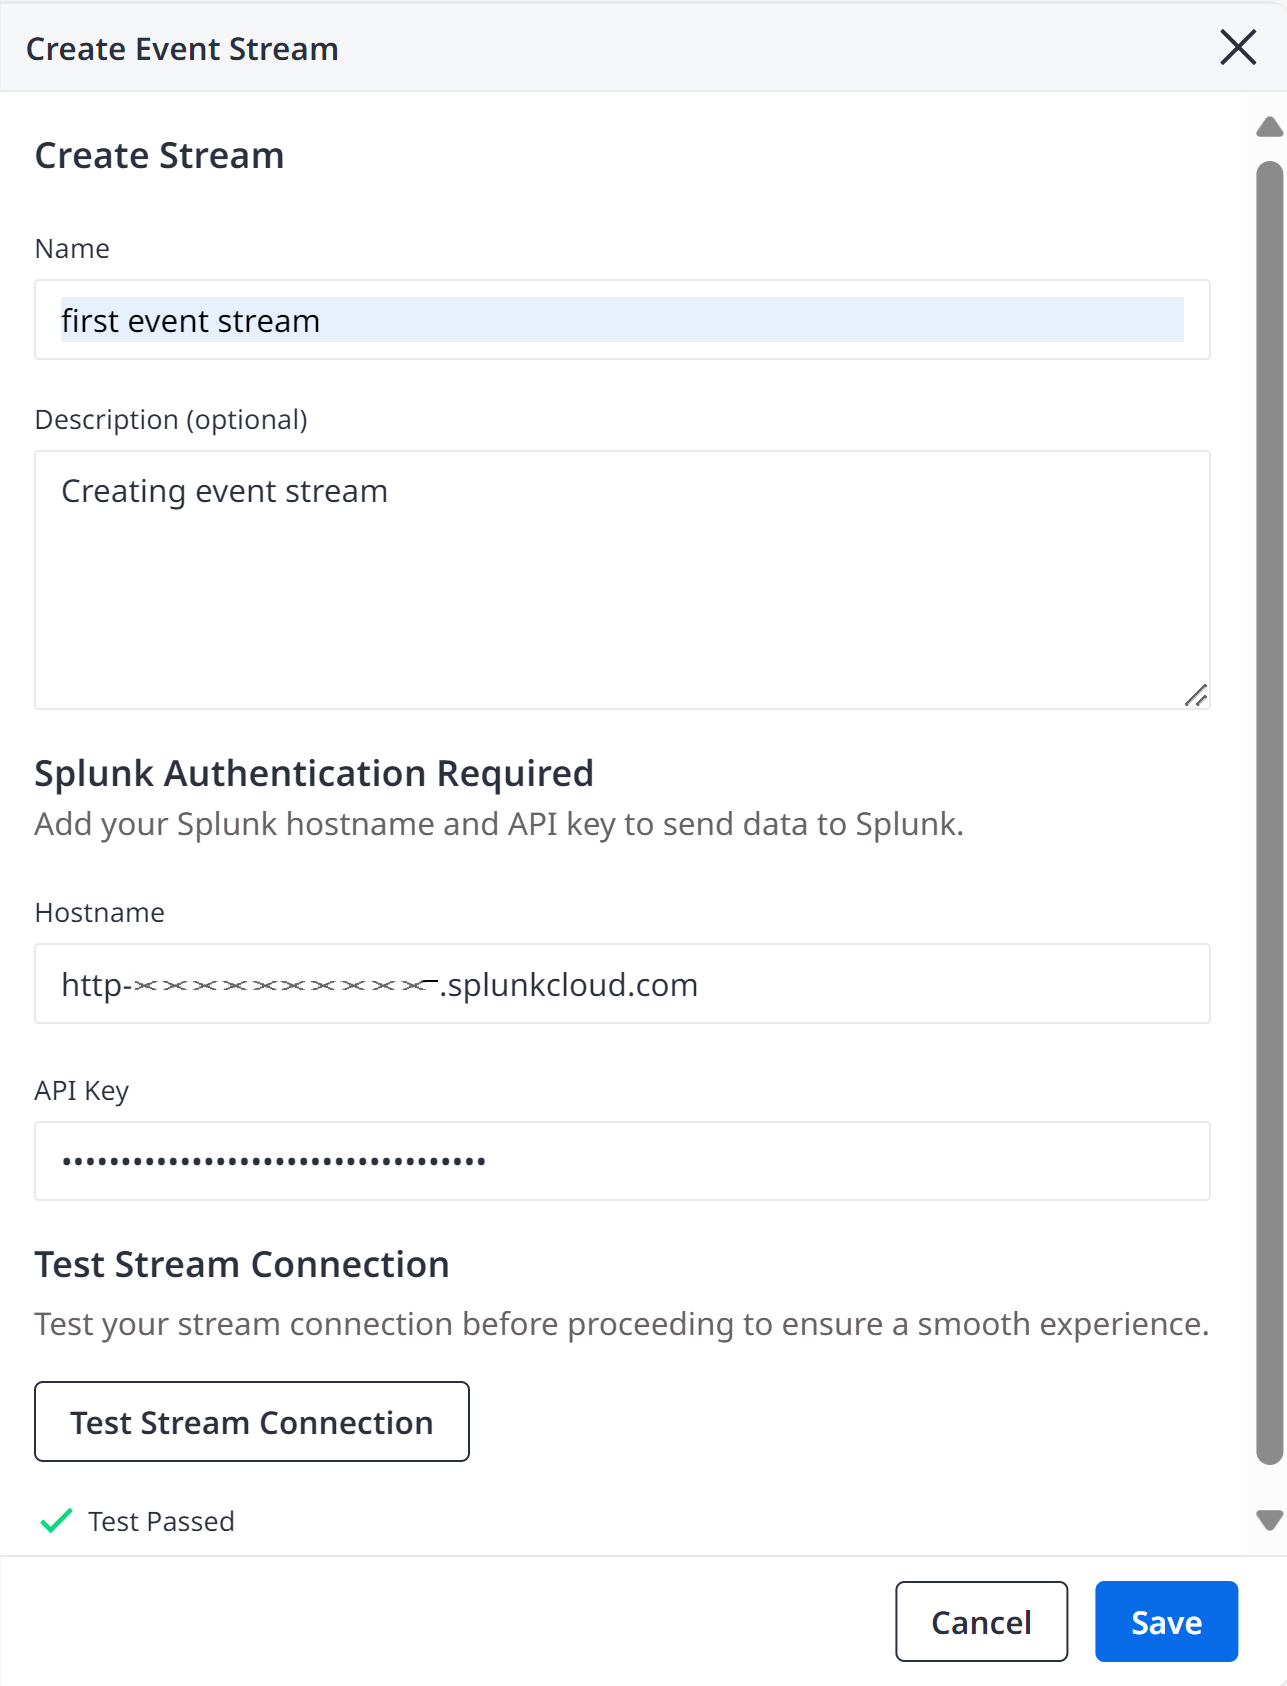
In the Create Event Stream modal, enter a user-friendly name in the Name field.
-
Optional. Enter a description for the event stream in the description field.
-
Enter your Splunk hostname and API key in the fields provided to send data to Splunk.
The connection hostname should be taken from the HTTP Event Collector URI. The hostname should be specified as a string with an optional port-number suffix; valid values include
http-inputs-my-org.splunkcloud.comorsplunk.example.com:8443.The API Key should be the HTTP Event Collector token that was generated when creating the Splunk HEC endpoint. This will be stored in an encrypted format that can only be decrypted by the worker sending Observability Stream data.
You can create a new stream by sending a POST request to the /v1/organizations/{org-id}/streams endpoint.
curl -X POST \
    -H "Content-Type: application/json" \
    -H "Authorization: bearer <API_TOKEN>" \
    "https://observability.equinixmetal.net/v1/organizations/{org-id}/streams" \
    -d '{
        "stream_name": "<string>",
        "description": "<string>",
        "connection": {,
             "type": "splunk",
             "api_key": "<string>",
             "hostname": "<string>"
    }
Body Parameters:
"org-id"(required) - The Metal organization ID that owns the stream."stream_name"(required) - Enter a name for this stream."description"(optional) - Include a description for a stream."connection"(required) - The connection parameters that define how data in an observability stream will be delivered to the customer.
Testing the Stream Connection
- Console
- API
Before you stream a data connection to Splunk, you must test it to ensure its validity. To test the stream connection, do the following:
-
In the Create Event Stream modal, enter your Splunk hostname and API key in the fields provided, if you have not already done so.
-
Click, Test Stream Connection.
The connection is valid if a Test Passed message appears on the screen. An error message displays if the test connection does NOT pass. You must receive a Test Passed message to ensure that the test connection is a valid to stream data to Splunk.
-
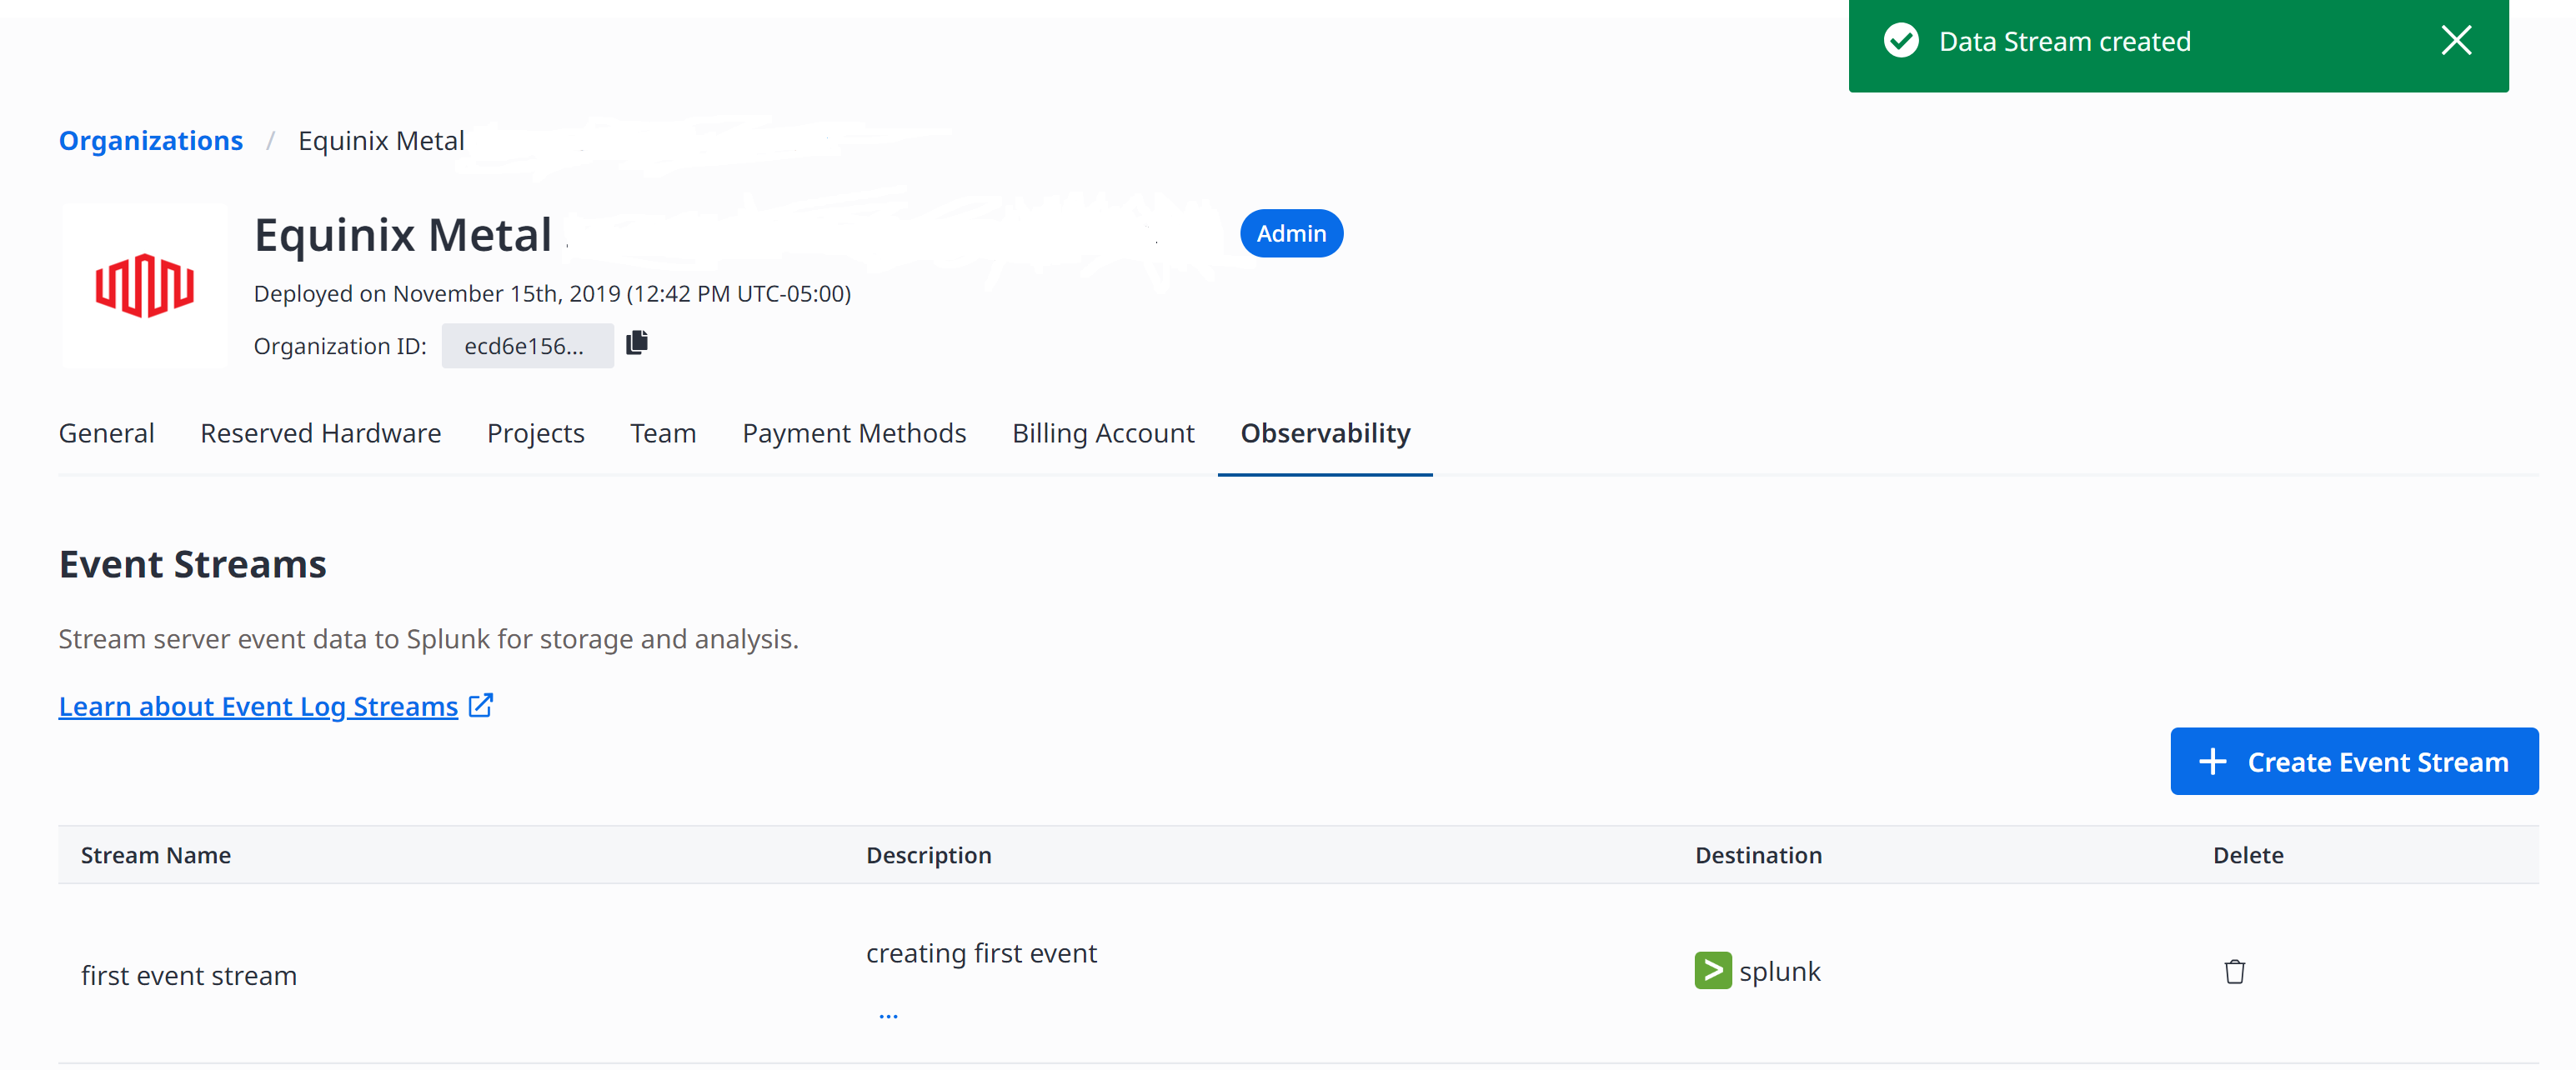
Click Save to save the event stream. The Event stream is saved in the Event Streams table on the Observability page.
You can test a new stream connection by sending a POST request to the v1/organizations/{org-id}/connection/validate endpoint.
curl -X POST \
    -H "Content-Type: application/json" \
    -H "Authorization: bearer <API_TOKEN>" \
    "https://observability.equinixmetal.net/v1/organizations/{org-id}/connection/validate \
    -d '{
             "type": "splunk",
             "api_key": "<string>",
             "hostname": "<string>"
    }
Body Parameters:
"type"(required) - The type of system to connect to. This determines the available parameters."api_key"(required) - The API key that will be used to authenticate the connection to the Splunk HTTP Event Collector. The API key will be stored encrypted."hostname"(required) - The hostname of the Splunk server to connect to with an optional port number suffix.
Managing an Event Stream
- Console
- API
Once the event stream is created in the Metal console, you can manage the event stream from your Organization's Observability tab.
To get a list of all observability streams configured for the provided organization, send a GET request to the /v1/organizations/{org-id}/streams endpoint.
curl -X GET \
-H "Authorization: bearer <API_TOKEN>" \
"https://observability.equinixmetal.net/v1/organizations/{org-id}/streams"
To retrieve the configuration details for the provided stream based on its owner and ID, send a GET request to the /v1/organizations/{org-id}/streams/{stream-id} endpoint.
curl -X GET \
-H "Authorization: bearer <API_TOKEN>" \
"https://observability.equinixmetal.net/v1/organizations/{org-id}/streams/{stream-id}"
To update the configuration for an existing observability stream, send a PUT request to /v1/organizations/{org-id}/streams/{stream-id} endpoint.
Note: You cannot update the values for sensitive fields such as connection API keys using this method; you must delete the stream and recreate it using the new value.
curl -X PUT \
    -H "Content-Type: application/json" \
    -H "Authorization: bearer <API_TOKEN>" \
    "https://observability.equinixmetal.net/v1/organizations/{org-id}/streams/{stream-id} \
    -d '{
        "stream_name": "<string>",
        "description": "<string>",
        "connection": {
            "type": "splunk",
            "hostname": "<string>"
        }
    }'
Deleting an Event Stream
- Console
- API
To stop the data stream to your Splunk instance, you can delete the event stream. To delete an event stream, do the following:
-
In the Event Streams table, click the trash can icon from the Delete column. The Delete event stream window appears.
-
Enter Delete in the field and click, Delete.
In the API, you can delete a stream by sending a DELETE request to the /v1/organizations/{org-id}/streams/{stream-id} endpoint.
curl -X DELETE -H "Authorization: bearer <API_TOKEN>" \
"https://observability.equinixmetal.net/v1/organizations/{org-id}/streams/{stream-id}"
Once a stream is deleted, it will immediately stop accepting new data from sources, but will continue delivering in-flight data. Once all in-flight data has been delivered, the stream is deleted and all resources are freed.
Splunk Event Metadata
The Observability Service sets the following Splunk Event metadata keys for every audit log event that it sends to your stream:
time- The timestamp at which the event occurred, specified in seconds since the Unix epoch.source- All events will specify a source ofequinix.sourcetype- Audit log events will specify a source type oflog.fields- Additional fields for indexing as described below.
Index Fields
In addition to the standard Splunk metadata keys described above, the Observability Service sets the following custom index fields for each log event that it sends to your stream. These fields are optional and will be omitted if absent.
level- A human-readable indication of the logging level, such asINFOorDEBUG.severity- A numeric severity level; higher numbers indicate more severe events (such as errors or violations).
Splunk Event Data
The content of the event key sent to the Splunk HTTP Event Collector as "Event data" is a structured JSON document with application-specific information about the events being logged.
For a complete reference, refer to the Splunk Event Schema Documentation.
- Splunk Event - Example JSON
- Splunk Event - JSON Schema
{
"stream" : {
    "streamId" : "dce13c1d-0589-406b-af40-854156a0621e",
    "streamName" : "Example Stream"
},
"source" : {
    "category" : "audit",
    "type" : "api_request",
    "service" : "metal",
    "organizationId" : "99be473c-ee3c-4aeb-a678-eba3fdae7ca6",
    "projectId" : "99be473c-ee3c-4aeb-a678-eba3fdaebeef"

},
"schema" : "v1",
"timestamp" : "2024-04-16T14:58:21.442334Z",
"level" : "INFO",
"eventId" : "6910f03f-ec60-42fc-9e9d-c5f6af2f732d",
"event" : {
    "eventName" : "instance_provision_requested",
    "status" : "failed",
    "auth" : {
        "authType" : "user",
        "user" : {
            "userId" : "582865f9-904b-4061-b536-2420eb01ecdc",
            "userName" : "jdoe@equinix.com"
        },
        "role" : {
            "roleName" : "collaborator"
        }
    },
    "httpRequest" : {
        "host" : "api.equinix.com",
        "method" : "PUT",
        "path" : "/metal/v1/projects/99f8e7f1-fe4a-441a-ade9-687743f080f6",
        "scheme" : "http",
        "statusCode" : 200,
        "userAgent" : "metal-cli/metal equinix-sdk-go/0.30.0",
        "sourceIpAddress" : "111.111.111.11"
    }
}
}
{
"description" : "The customer-facing log format for the Equinix Observability Service.",
"type" : "object",
"properties" : {
    "stream" : {
    "description" : "Provides metadata about the observability stream that produced this log entry; can be used to differentiate data sources in situations where multiple streams are writing to the same destination.",
    "type" : "object",
    "properties" : {
        "streamId" : {
        "description" : "Unique identifier of the observability stream that produced this log entry.",
        "type" : "string",
        "format" : "uuid"
        },
        "streamName" : {
        "description" : "Name of the observability stream that produced this log entry.",
        "type" : "string",
        "examples" : [ "Example Stream" ]
        }
    },
    "required" : [ "streamId", "streamName" ],
    "title" : "Stream",
    "examples" : [ {
        "streamId" : "e55f79d4-0d8a-4460-a566-ff93af4f90e4",
        "streamName" : "Example Stream"
    } ]
    },
    "source" : {
    "description" : "Provides metadata about the source from which this log entry originated.",
    "type" : "object",
    "properties" : {
        "category" : {
        "description" : "Groups logs into high-level application categories.",
        "type" : "string",
        "enum" : [ "audit", "validation" ]
        },
        "type" : {
        "description" : "Differentiates types of log events withing a particular category.",
        "type" : "string",
        "enum" : [ "api_request", "validation_request" ]
        },
        "service" : {
        "description" : "Indicates the service that produced this log entry.",
        "type" : "string",
        "enum" : [ "metal" ]
        },
        "organizationId" : {
        "description" : "Indicates the customer Organization ID with which this log entry is associated.",
        "type" : "string",
        "format" : "uuid"
        },
        "projectId" : {
        "description" : "Indicates the customer Project ID with which this log entry is associated.",
        "type" : "string",
        "format" : "uuid"
        }
    },
    "required" : [ "category", "type", "service", "organizationId" ],
    "title" : "Source",
    "examples" : [ {
        "category" : "audit",
        "type" : "api_request",
        "service" : "metal",
        "organizationId" : "0e714017-6d9c-4dc5-828d-b8a156502496"
    } ]
    },
    "schema" : {
    "description" : "Indicates the schema version of this log entry.",
    "type" : "string",
    "enum" : [ "v1" ]
    },
    "timestamp" : {
    "description" : "The timestamp at which this log entry was produced, in ISO8601 format.",
    "type" : "string",
    "format" : "date-time",
    "examples" : [ "2024-04-16T14:58:21.442334Z" ]
    },
    "level" : {
    "description" : "A human-readable indication of the severity level of this log entry.",
    "type" : "string",
    "examples" : [ "INFO" ]
    },
    "eventId" : {
    "description" : "Unique identifier for this log event.",
    "type" : "string",
    "format" : "uuid"
    },
    "event" : {
    "description" : "The application-specific log event payload. In the future the specific format will vary based on the\n  source category and type, but for now we use a single log event schema.",
    "type" : "object",
    "properties" : {
        "eventName" : {
        "description" : "An application-provided name for the event. Event names should be fixed by the application\n  (i.e. should not vary based on request parameters) to enable filtering/querying by the customer, and should carry\n  meaning to the customer. In the case of API request logs, this would correspond to an operation name.",
        "type" : "string",
        "examples" : [ "project_updated", "instance_provision_requested" ]
        },
        "status" : {
        "description" : "An indication of the status associated with the event, e.g. request success/failure.",
        "type" : "string",
        "examples" : [ "success", "failed", "unauthorized" ]
        },
        "auth" : {
        "description" : "Provides authentication and authorization information about the principal associated with the\n  log event. In most cases, this will be the one who made the request.",
        "type" : "object",
        "properties" : {
            "authType" : {
            "description" : "Indicates the type of entity for the principal associated with the request.",
            "type" : "string",
            "enum" : [ "user" ]
            },
            "user" : {
            "description" : "Provides identifying information about the user associated with the log event.",
            "type" : "object",
            "properties" : {
                "userId" : {
                "description" : "Unique user identifier; this is an opaque system-assigned ID that is not expected to be recognizable to people.",
                "type" : "string",
                "examples" : [ "1bec4119-a889-4809-89e9-c4572dc002ec" ]
                },
                "userName" : {
                "description" : "Provides a more human-friendly display name for the user.",
                "type" : "string",
                "examples" : [ "jdoe@equinix.com" ]
                }
            },
            "required" : [ "userId", "userName" ],
            "title" : "User",
            "examples" : [ {
                "userId" : "1bec4119-a889-4809-89e9-c4572dc002ec",
                "userName" : "jdoe@equinix.com"
            } ]
            },
            "role" : {
            "description" : "Provides information about the role associated with the log event, which determines what permissions\n  are allowed. If the principal has access to multiple roles, this indicates the one they assumed when making the\n  request.",
            "type" : "object",
            "properties" : {
                "roleName" : {
                "description" : "The human-friendly display name for the role.",
                "type" : "string",
                "examples" : [ "collaborator" ]
                }
            },
            "required" : [ "roleName" ],
            "title" : "Role",
            "examples" : [ {
                "roleName" : "collaborator"
            } ]
            }
        },
        "required" : [ "authType", "user", "role" ],
        "title" : "AuthInfo",
        "examples" : [ {
            "authType" : "user",
            "user" : {
            "userId" : "1bec4119-a889-4809-89e9-c4572dc002ec",
            "userName" : "jdoe@equinix.com"
            },
            "role" : {
            "roleName" : "collaborator"
            }
        } ]
        },
        "httpRequest" : {
        "description" : "Provides details about the HTTP request associated with the log event, if there is one (for now, there\n  will always be one).",
        "type" : "object",
        "properties" : {
            "host" : {
            "description" : "The hostname to which the original HTTP request was made.",
            "type" : "string",
            "examples" : [ "api.equinix.com" ]
            },
            "method" : {
            "description" : "The HTTP request method.",
            "type" : "string",
            "examples" : [ "PUT" ]
            },
            "path" : {
            "description" : "The path portion of the original HTTP request URL.",
            "type" : "string",
            "examples" : [ "/metal/v1/projects/99f8e7f1-fe4a-441a-ade9-687743f080f6" ]
            },
            "scheme" : {
            "description" : "The HTTP request scheme",
            "type" : "string",
            "enum" : [ "http", "https" ]
            },
            "statusCode" : {
            "description" : "The HTTP status code that resulted from the processing of the request.",
            "type" : "integer",
            "examples" : [ 200 ]
            },
            "userAgent" : {
            "description" : "The user-agent that issued the request, as reported by the HTTP client.",
            "type" : "string",
            "examples" : [ "metal-cli/metal equinix-sdk-go/0.30.0" ]
            },
            "sourceIpAddress" : {
            "description" : "The IP address from which the HTTP request was sent.",
            "type" : "string",
            "examples" : [ "111.111.111.11" ]
            }
        },
        "required" : [ "host", "method", "path", "scheme", "statusCode", "userAgent", "sourceIpAddress" ],
        "title" : "HttpRequest",
        "examples" : [ {
            "host" : "api.equinix.com",
            "method" : "PUT",
            "path" : "/metal/v1/projects/99f8e7f1-fe4a-441a-ade9-687743f080f6",
            "scheme" : "https",
            "statusCode" : 200,
            "userAgent" : "metal-cli/metal equinix-sdk-go/0.30.0",
            "sourceIpAddress" : "111.111.111.11"
        } ]
        },
        "resource" : {
        "description" : "The resource associated with the request (for future use)",
        "type" : "object",
        "properties" : { },
        "examples" : [ { } ]
        },
        "request" : {
        "description" : "Detailed request parameters (for future use)",
        "type" : "object",
        "properties" : { },
        "examples" : [ { } ]
        },
        "response" : {
        "description" : "Detailed response body (for future use)",
        "type" : "object",
        "properties" : { },
        "examples" : [ { } ]
        }
    },
    "required" : [ "eventName", "status", "auth", "httpRequest" ],
    "title" : "Event",
    "examples" : [ {
        "eventName" : "project_updated",
        "status" : "unauthorized",
        "auth" : {
        "authType" : "user",
        "user" : {
            "userId" : "1bec4119-a889-4809-89e9-c4572dc002ec",
            "userName" : "jdoe@equinix.com"
        },
        "role" : {
            "roleName" : "collaborator"
        }
        },
        "httpRequest" : {
        "host" : "api.equinix.com",
        "method" : "PUT",
        "path" : "/metal/v1/projects/99f8e7f1-fe4a-441a-ade9-687743f080f6",
        "scheme" : "http",
        "statusCode" : 200,
        "userAgent" : "metal-cli/metal equinix-sdk-go/0.30.0",
        "sourceIpAddress" : "111.111.111.11"
        },
        "resource" : { },
        "response" : { }
    } ]
    }
},
"required" : [ "stream", "source", "schema", "timestamp", "level", "eventId", "event" ],
"title" : "LogEntry",
"examples" : [ {
    "stream" : {
    "streamId" : "b47f2eaf-d5c6-485c-a081-5d12333aa2e2",
    "streamName" : "Example Stream"
    },
    "source" : {
    "category" : "validation",
    "type" : "validation_request",
    "service" : "metal",
    "organizationId" : "a2337a57-4ad0-4708-abc6-c0973055c91e"
    },
    "schema" : "v1",
    "timestamp" : "2024-04-16T14:58:21.442334Z",
    "level" : "INFO",
    "eventId" : "e6de0ec4-027e-4733-aeb4-058c1fc53493",
    "event" : {
    "eventName" : "instance_provision_requested",
    "status" : "unauthorized",
    "auth" : {
        "authType" : "user",
        "user" : {
        "userId" : "1bec4119-a889-4809-89e9-c4572dc002ec",
        "userName" : "jdoe@equinix.com"
        },
        "role" : {
        "roleName" : "collaborator"
        }
    },
    "httpRequest" : {
        "host" : "api.equinix.com",
        "method" : "PUT",
        "path" : "/metal/v1/projects/99f8e7f1-fe4a-441a-ade9-687743f080f6",
        "scheme" : "http",
        "statusCode" : 200,
        "userAgent" : "metal-cli/metal equinix-sdk-go/0.30.0",
        "sourceIpAddress" : "111.111.111.11"
    },
    "response" : { }
    }
} ]
}