メトリクス
Monitor specific metric data to measure performance of your assets in near real-time. Streaming network data includes the following metrics:
-
Port Bandwidth Usage Metrics provide a bit per second (bit/s) output for the data transmitted (tx) or received (rx) by the port.
-
Connection Bandwidth Usage provide a bit per second (bit/s) output for the data transmitted (tx) or received (rx) over a connection where a port is the a-side, between a cloud router and a port, and between a cloud router and a cloud service provider.
-
Metro Latency Metrics provide the latency in milliseconds (ms) from a single subscribed metro code to other metros and latency between all metro pairs.
-
Port Error and Dropped Metrics provide the number of packet discards on a given port due to packet format, transmission errors, or even when the port doesn't have bandwidth to accept the packet.
-
Connection Packet Dropped Metrics provide the number of packets dropped on a connection due to exceeding bandwidth limits for both transmitted (tx) or received (rx) data. Only available on the port side of a connection.
Refer to the reference of supported metrics for each asset.
Viewing Metrics
You can view metrics for an individual port or virtual connection in the Customer Portal. Usage and Packet Drop metrics are available.
-
[カスタマーポータル]>[Fabricダッシュボード]にログインします。
-
Navigate to your Port Inventory or Connections Inventory.
-
Select a port or virtual connection.
-
From the port detail or connection detail page, click Metrics.
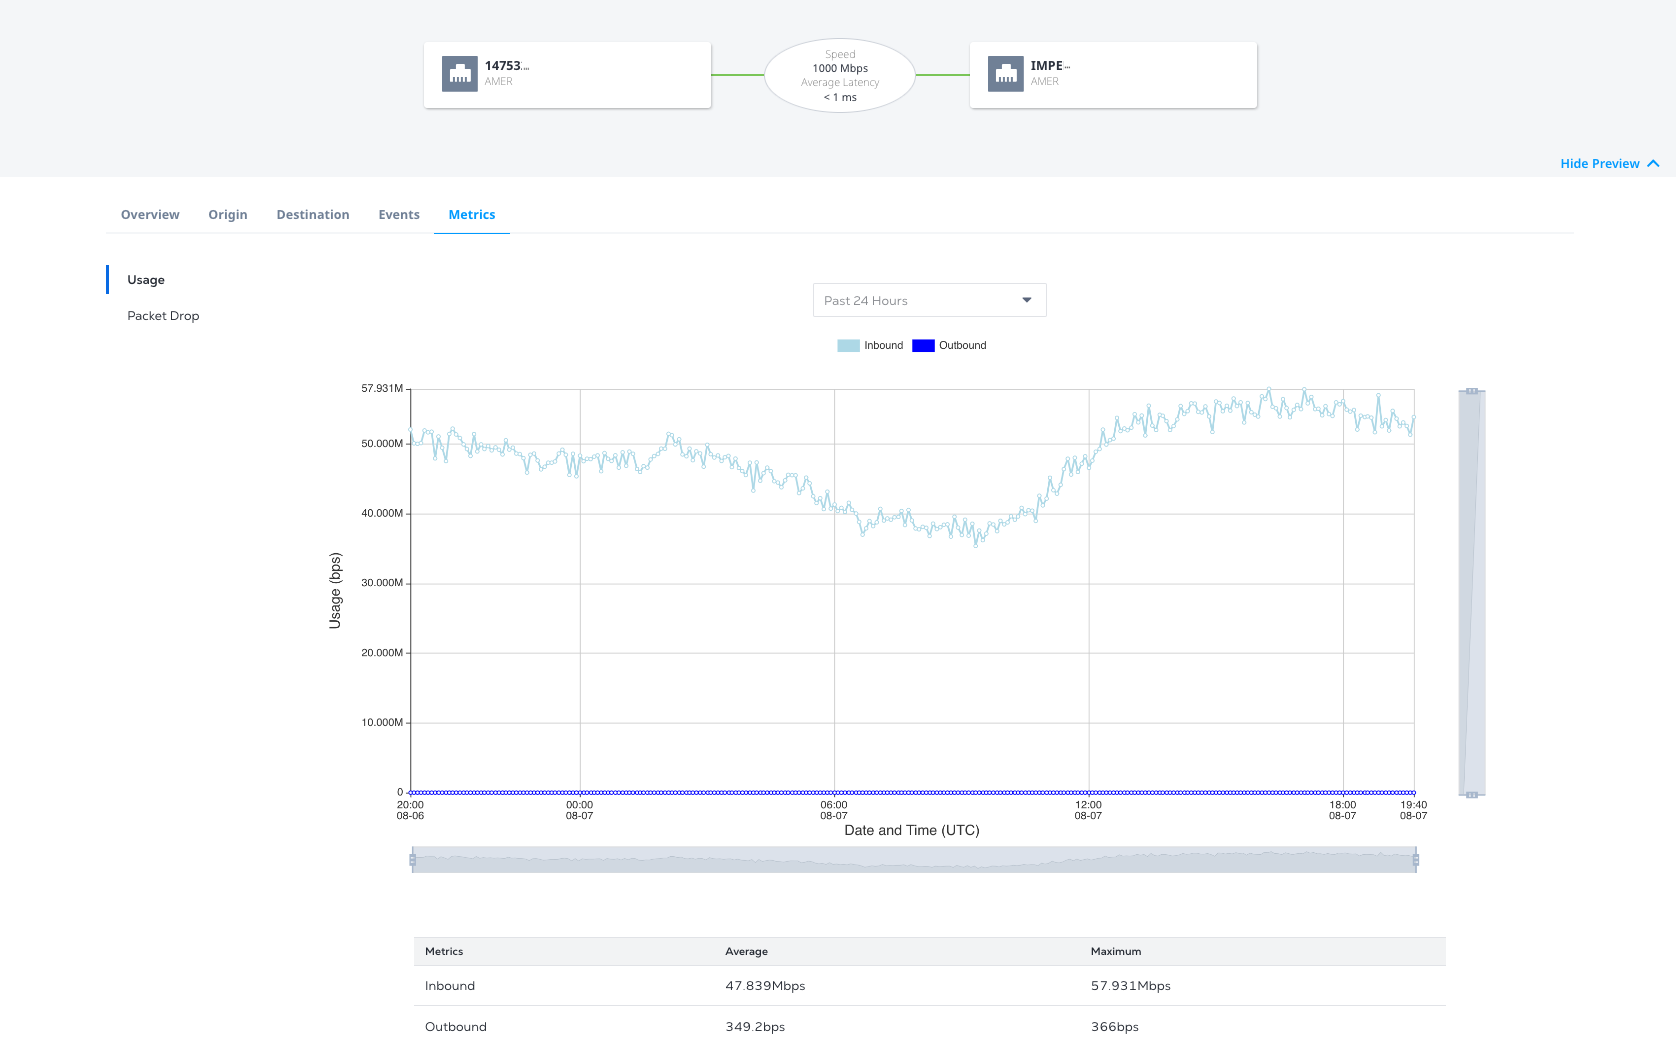
Viewing Metrics from the API
Equinix APIから個々の資産のメトリックを取得できる。
都市圏間のレイテンシ
To view the latency between two metros, send a GET request to the /fabric/v4/<asset>/<asset_id>/metrics endpoint where:
assetismetrosasset_idis the two-letter Metro code- and specifying
name=equinix.fabric.metro.<origin_metro_code>_<destination_metro_code>.latencyas the query parameter for the request.
サンプルcURLリクエスト:
curl -X 'GET' 'https://api.equinix.com/fabric/v4/metros/SV/metrics?name=equinix.fabric.metro.sv_am.latency' \
-H 'Content-Type: application/json' \
-H 'Authorization: Bearer <Bearer Token>'
回答例
{
    "pagination": {
        "offset": 0,
        "limit": 10,
        "total": 3,
        "next": null,
        "previous": null
    },
    "data": [
        {
            "type": "GAUGE",
            "name": "equinix.fabric.metro.sv_am.latency",
            "unit": "ms",
            "resource": {
                "href": "https://uatapi.equinix.com/fabric/v4/metros/SV",
                "type": "XF_METRO",
                "description": "Silicon Valley to Amsterdam intermetro latency, average in milliseconds"
            },
            "summary": {
                "mean": 136.9,
                "max": 137
            },
            "datapoints": [
                {
                    "endDateTime": "2025-06-05T18:50:03Z",
                    "value": 137
                },
                {
                    "endDateTime": "2025-06-05T18:55:03Z",
                    "value": 137
                },
                {
                    "endDateTime": "2025-06-05T19:00:03Z",
                    "value": 137
                },
                {
                    "endDateTime": "2025-06-05T19:05:03Z",
                    "value": 137
                }
            ]
        }
    ]
}
To view the real-time latency between all metro pairs, send a GET request to the /fabric/v4/metrics endpoint. In the query parameters, specify:
name=equinix.fabric.metro.*.latencyandvalue=last.- Optionally include the parameter
limit=<limit>to specify the desired number of metric types to return from the results. - Optionally include the parameter
offset=<offset>to specify the number of results to skip.
サンプルcURLリクエスト:
curl -X 'GET' 'https://api.equinix.com/fabric/v4/metrics?value=last&limit=3&name=equinix.fabric.metro.*.latency' \
-H 'Content-Type: application/json' \
-H 'Authorization: Bearer <Bearer Token>'
回答例
{
  "pagination": {
    "offset": 0,
    "limit": 3,
    "total": 4112,
    "next": "/metrics?offset=3&limit=3&fromDateTime=2026-01-29T18:05:44.041Z&name=equinix.fabric.metro.*.latency&toDateTime=2026-01-30T18:05:44.041Z"
  },
  "data": [
    {
      "type": "GAUGE",
      "name": "equinix.fabric.metro.am_at.latency",
      "unit": "ms",
      "resource": {
        "href": "https://api.equinix.com/fabric/v4/metros/AM",
        "type": "XF_METRO",
        "code": "AM",
        "description": "Amsterdam to Atlanta intermetro latency, average in milliseconds"
      },
      "datapoints": [
        {
          "endDateTime": "2026-01-30T18:05:00Z",
          "value": 94.7
        }
      ]
    },
    {
      "type": "GAUGE",
      "name": "equinix.fabric.metro.am_ba.latency",
      "unit": "ms",
      "resource": {
        "href": "https://api.equinix.com/fabric/v4/metros/AM",
        "type": "XF_METRO",
        "code": "AM",
        "description": "Amsterdam to Barcelona intermetro latency, average in milliseconds"
      },
      "datapoints": [
        {
          "endDateTime": "2026-01-30T18:05:00Z",
          "value": 28.8
        }
      ]
    },
    {
      "type": "GAUGE",
      "name": "equinix.fabric.metro.am_bg.latency",
      "unit": "ms",
      "resource": {
        "href": "https://api.equinix.com/fabric/v4/metros/AM",
        "type": "XF_METRO",
        "code": "AM",
        "description": "Amsterdam to Bogota intermetro latency, average in milliseconds"
      },
      "datapoints": [
        {
          "endDateTime": "2026-01-30T18:05:00Z",
          "value": 159
        }
      ]
    }
  ]
}
ポート帯域幅受信使用量
To view a port's bandwidth usage, send a GET request to the /fabric/v4/<asset>/<asset_id>/metrics endpoint where:
assetisportsasset_idis the uuid of a specific port
Query Parameters:
- Inbound -
equinix.fabric.port.bandwidth_rx.usage - Outbound -
equinix.fabric.port.bandwidth_tx.usage
To see all bandwidth usage, specify name=equinix.fabric.port.bandwidth_rx.usage&name=equinix.fabric.port.bandwidth_tx.usage as the query parameter for the request. Specify a time period with fromDateTime and toDateTime.
サンプルcURLリクエスト:
curl -X 'GET' 'https://api.equinix.com/fabric/v4/ports/<port_id>/metrics?name=equinix.fabric.port.bandwidth_rx.usage&name=equinix.fabric.port.bandwidth_tx.usage&fromDateTime=2025-05-12T19%3A18%3A00Z&toDateTime=2025-05-13T19%3A18%3A00Z' \
-H 'Content-Type: application/json' \
-H 'Authorization: Bearer <Bearer Token>'
回答例
{
    "pagination": {
        "offset": 0,
        "limit": 10,
        "total": 2,
        "next": null,
        "previous": null
    },
    "data": [
        {
            "type": "GAUGE",
            "name": "equinix.fabric.port.bandwidth_rx.usage",
            "unit": "bit/s",
            "resource": {
                "href": "https://api.equinix.com/fabric/v4/ports/<portId>",
                "type": "XF_PORT",
                "uuid": "<portId>",
                "state": "PROVISIONED",
                "name": "TEST-PORT-NAME"
            },
            "summary": {
                "mean": 198.7,
                "max": 219
            },
            "datapoints": [
                {
                    "endDateTime": "2025-05-12T19:20:47.000Z",
                    "value": 202
                },
                {
                    "endDateTime": "2025-05-12T19:25:51.000Z",
                    "value": 192
                },
                {
                    "endDateTime": "2025-05-12T19:30:51.000Z",
                    "value": 203
                },
                {
                    "endDateTime": "2025-05-12T19:35:53.000Z",
                    "value": 194
                }
            ]
        },
        {
            "type": "GAUGE",
            "name": "equinix.fabric.port.bandwidth_tx.usage",
            "unit": "bit/s",
            "resource": {
                "href": "https://api.equinix.com/fabric/v4/ports/<portId>",
                "type": "XF_PORT",
                "uuid": "<portId>",
                "state": "PROVISIONED",
                "name": "TEST-PORT-NAME"
            },
            "summary": {
                "mean": 0,
                "max": 0
            },
            "datapoints": [
                {
                    "endDateTime": "2025-05-12T19:20:47.000Z",
                    "value": 0
                },
                {
                    "endDateTime": "2025-05-12T19:25:51.000Z",
                    "value": 0
                },
                {
                    "endDateTime": "2025-05-12T19:30:51.000Z",
                    "value": 0
                },
                {
                    "endDateTime": "2025-05-12T19:35:53.000Z",
                    "value": 0
                }
            ]
        }
    ]
}
Port Packets Dropped
To view a count of the packets dropped from a port, send a GET request to the /fabric/v4/<asset>/<asset_id>/metrics endpoint where:
assetisportsasset_idis the uuid of a specific port
Query Parameters:
- Inbound -
equinix.fabric.port.packets_dropped_rx.count - Outbound -
equinix.fabric.port.packets_dropped_tx.count
To get a count of all dropped packets, specify name=equinix.fabric.port.packets_dropped_rx.count&name=equinix.fabric.port.packets_dropped_tx.count as the query parameter for the request. Specify a time period with fromDateTime and toDateTime.
サンプルcURLリクエスト:
curl -X 'GET' 'https://api.equinix.com/fabric/v4/ports/<portId>/metrics?name=equinix.fabric.port.packets_dropped_rx.count&name=equinix.fabric.port.packets_dropped_tx.count&fromDateTime=2025-05-12T19%3A18%3A00Z&toDateTime=2025-05-13T19%3A18%3A00Z' \
-H 'Content-Type: application/json' \
-H 'Authorization: Bearer <Bearer Token>'
回答例
{
    "pagination": {
        "offset": 0,
        "limit": 10,
        "total": 2,
        "next": null,
        "previous": null
    },
    "data": [
        {
            "type": "SUM",
            "name": "equinix.fabric.port.packets_dropped_rx.count",
            "unit": "packet",
            "resource": {
                "href": "https://api.equinix.com/fabric/v4/ports/<portId>",
                "type": "XF_PORT",
                "uuid": "<portId>",
                "state": "PROVISIONED",
                "name": "TEST-PORT-NAME"
            },
            "summary": {
                "mean": 0,
                "max": 0
            }
        },
        {
            "type": "SUM",
            "name": "equinix.fabric.port.packets_dropped_tx.count",
            "unit": "packet",
            "resource": {
                "href": "https://api.equinix.com/fabric/v4/ports/<portId>",
                "type": "XF_PORT",
                "uuid": "<portId>",
                "state": "PROVISIONED",
                "name": "TEST-PORT-NAME"
            },
            "summary": {
                "mean": 0,
                "max": 0
            }
        }
    ]
}
Port Packet Errors
To view the packet errors for a port, send a GET request to the /fabric/v4/<asset>/<asset_id>/metrics endpoint
assetisportsasset_idis the uuid of a specific port
Query Parameters:
- Inbound -
equinix.fabric.port.packets_erred_rx.count - Outbound -
equinix.fabric.port.packets_erred_tx.count
To get a count for all packet errors, specify name=equinix.fabric.port.packets_erred_rx.count&name=equinix.fabric.port.packets_erred_tx.count as the query parameter for the request. Specify a time period with fromDateTime and toDateTime.
サンプルcURLリクエスト:
curl -X 'GET' 'https://api.equinix.com/fabric/v4/ports/<portId>/metrics?name=equinix.fabric.port.packets_erred_rx.count&name=equinix.fabric.port.packets_erred_tx.count&fromDateTime=2025-05-12T19%3A18%3A00Z&toDateTime=2025-05-13T19%3A18%3A00Z' \
-H 'Content-Type: application/json' \
-H 'Authorization: Bearer <Bearer Token>'
回答例
{
    "pagination": {
        "offset": 0,
        "limit": 10,
        "total": 2,
        "next": null,
        "previous": null
    },
    "data": [
        {
            "type": "SUM",
            "name": "equinix.fabric.port.packets_erred_rx.count",
            "unit": "packet",
            "resource": {
                "href": "https://api.equinix.com/fabric/v4/ports/<portId>",
                "type": "XF_PORT",
                "uuid": "<portId>",
                "state": "PROVISIONED",
                "name": "TEST-PORT-NAME"
            },
            "summary": {
                "mean": 0,
                "max": 0
            }
        },
        {
            "type": "SUM",
            "name": "equinix.fabric.port.packets_erred_tx.count",
            "unit": "packet",
            "resource": {
                "href": "https://api.equinix.com/fabric/v4/ports/<portId>",
                "type": "XF_PORT",
                "uuid": "<portId>",
                "state": "PROVISIONED",
                "name": "TEST-PORT-NAME"
            },
            "summary": {
                "mean": 0,
                "max": 0
            }
        }
    ]
}
接続帯域幅受信使用量
To view a connection's bandwidth usage, send a GET request to the /fabric/v4/<asset>/<asset_id>/metrics endpoint where:
assetisconnectionsasset_idis the uuid of a specific connection
Query Parameters:
- Inbound -
equinix.fabric.connection.bandwidth_rx.usage - Outbound -
equinix.fabric.connection.bandwidth_tx.usage
To see all bandwidth usage, specify name=equinix.fabric.connection.bandwidth_rx.usage&name=equinix.fabric.connection.bandwidth_tx.usage as the query parameter for the request. Specify a time period with fromDateTime and toDateTime.
サンプルcURLリクエスト:
curl -X 'GET' 'https://api.equinix.com/fabric/v4/connections/<connectionId>/metrics?name=equinix.fabric.connection.bandwidth_rx.usage&name=equinix.fabric.connection.bandwidth_tx.usage&fromDateTime=2025-05-12T19%3A18%3A00Z&toDateTime=2025-05-13T19%3A18%3A00Z' \
-H 'Content-Type: application/json' \
-H 'Authorization: Bearer <Bearer Token>'
回答例
{
    "pagination": {
        "offset": 0,
        "limit": 10,
        "total": 2,
        "next": null,
        "previous": null
    },
    "data": [
        {
            "type": "GAUGE",
            "name": "equinix.fabric.connection.bandwidth_rx.usage",
            "unit": "bit/s",
            "resource": {
                "href": "https://api.equinix.com/fabric/v4/connections/<connectionId>",
                "type": "EVPL_VC",
                "uuid": "<connectionId>",
                "state": "PROVISIONED",
                "name": "TEST-CONNECTION-NAME"
            },
            "summary": {
                "mean": 0,
                "max": 0
            },
            "datapoints": [
                {
                    "endDateTime": "2025-05-12T19:22:48.000Z",
                    "value": 202
                },
                {
                    "endDateTime": "2025-05-12T19:27:50.000Z",
                    "value": 192
                },
                {
                    "endDateTime": "2025-05-12T19:31:51.000Z",
                    "value": 203
                },
                {
                    "endDateTime": "2025-05-12T19:37:45.000Z",
                    "value": 194
                }
            ]
        },
        {
            "type": "GAUGE",
            "name": "equinix.fabric.connection.bandwidth_tx.usage",
            "unit": "bit/s",
            "resource": {
                "href": "https://api.equinix.com/fabric/v4/connections/<connectionId>",
                "type": "EVPL_VC",
                "uuid": "<connectionId>",
                "state": "PROVISIONED",
                "name": "TEST-CONNECTION-NAME"
            },
            "summary": {
                "mean": 0,
                "max": 0
            },
            "datapoints": [
                {
                    "endDateTime": "2025-05-12T19:22:48.000Z",
                    "value": 0
                },
                {
                    "endDateTime": "2025-05-12T19:27:50.000Z",
                    "value": 0
                },
                {
                    "endDateTime": "2025-05-12T19:31:51.000Z",
                    "value": 0
                },
                {
                    "endDateTime": "2025-05-12T19:37:45.000Z",
                    "value": 0
                }
            ]
        }
    ]
}
Connection Packets Dropped
To view the packets dropped from a connection, send a GET request to the /fabric/v4/<asset>/<asset_id>/metrics endpoint where:
assetisconnectionsasset_idis the uuid of a specific connection
Metrics are available for the a-side, z-side, inbound, and outbound of the connection.
Query Parameters:
- Inbound a-side -
equinix.fabric.connection.packets_dropped_rx_aside_rateexceeded.count - Outbound a-side -
equinix.fabric.connection.packets_dropped_tx_aside_rateexceeded.count - Inbound z-side -
equinix.fabric.connection.packets_dropped_rx_zside_rateexceeded.count - Outbound z-side -
equinix.fabric.connection.packets_dropped_tx_zside_rateexceeded.count
To view all the dropped packets for the connection, specify name=equinix.fabric.connection.packets_dropped_rx_aside_rateexceeded.count&name=equinix.fabric.connection.packets_dropped_tx_aside_rateexceeded.count&name=equinix.fabric.connection.packets_dropped_rx_zside_rateexceeded.count&name=equinix.fabric.connection.packets_dropped_tx_zside_rateexceeded.count as the query parameter for the request. Specify a time period with fromDateTime and toDateTime.
curl -X 'GET' 'https://api.equinix.com/fabric/v4/connections/<connectionId>/metrics?name=equinix.fabric.connection.packets_dropped_rx_aside_rateexceeded.count&name=equinix.fabric.connection.packets_dropped_tx_aside_rateexceeded.count&name=equinix.fabric.connection.packets_dropped_rx_zside_rateexceeded.count&name=equinix.fabric.connection.packets_dropped_tx_zside_rateexceeded.count&fromDateTime=2025-05-12T19%3A18%3A00Z&toDateTime=2025-05-13T19%3A18%3A00Z' \
-H 'Content-Type: application/json' \
-H 'Authorization: Bearer <Bearer Token>'
回答例
{
    "pagination": {
        "offset": 0,
        "limit": 10,
        "total": 2,
        "next": null,
        "previous": null
    },
    "data": [
        {
            "type": "SUM",
            "name": "equinix.fabric.connection.packets_dropped_rx_aside_rateexceeded.count",
            "unit": "packet",
            "resource": {
                "href": "https://api.equinix.com/fabric/v4/connections/<connectionId>",
                "type": "EVPL_VC",
                "uuid": "<connectionId>",
                "state": "PROVISIONED",
                "name": "TEST-CONNECTION-NAME"
            },
            "summary": {
                "mean": 0,
                "max": 0
            },
             "datapoints": [
                {
                    "endDateTime": "2025-05-12T19:28:59.000Z",
                    "value": 0
                },
                {
                    "endDateTime": "2025-05-12T19:34:01.000Z",
                    "value": 0
                },
                {
                    "endDateTime": "2025-05-12T19:36:16.000Z",
                    "value": 0
                },
                {
                    "endDateTime": "2025-05-12T19:42:12.000Z",
                    "value": 0
                }
            ]
        },
        {
            "type": "SUM",
            "name": "equinix.fabric.connection.packets_dropped_tx_aside_rateexceeded.count",
            "unit": "packet",
            "resource": {
                "href": "https://api.equinix.com/fabric/v4/connections/<connectionId>",
                "type": "EVPL_VC",
                "uuid": "<connectionId>",
                "state": "PROVISIONED",
                "name": "TEST-CONNECTION-NAME"
            },
            "summary": {
                "mean": 0,
                "max": 0
            },
             "datapoints": [
                {
                    "endDateTime": "2025-05-12T19:28:59.000Z",
                    "value": 0
                },
                {
                    "endDateTime": "2025-05-12T19:34:01.000Z",
                    "value": 0
                },
                {
                    "endDateTime": "2025-05-12T19:36:16.000Z",
                    "value": 0
                },
                {
                    "endDateTime": "2025-05-12T19:42:12.000Z",
                    "value": 0
                }
            ]
        },
               {
            "type": "SUM",
            "name": "equinix.fabric.connection.packets_dropped_rx_zside_rateexceeded.count",
            "unit": "packet",
            "resource": {
                "href": "https://api.equinix.com/fabric/v4/connections/<connectionId>",
                "type": "EVPL_VC",
                "uuid": "<connectionId>",
                "state": "PROVISIONED",
                "name": "TEST-CONNECTION-NAME"
            },
            "summary": {
                "mean": 0,
                "max": 0
            },
             "datapoints": [
                {
                    "endDateTime": "2025-05-12T19:28:59.000Z",
                    "value": 0
                },
                {
                    "endDateTime": "2025-05-12T19:34:01.000Z",
                    "value": 0
                },
                {
                    "endDateTime": "2025-05-12T19:36:16.000Z",
                    "value": 0
                },
                {
                    "endDateTime": "2025-05-12T19:42:12.000Z",
                    "value": 0
                }
            ]
        },
        {
            "type": "SUM",
            "name": "equinix.fabric.connection.packets_dropped_tx_zside_rateexceeded.count",
            "unit": "packet",
            "resource": {
                "href": "https://api.equinix.com/fabric/v4/connections/<connectionId>",
                "type": "EVPL_VC",
                "uuid": "<connectionId>",
                "state": "PROVISIONED",
                "name": "TEST-CONNECTION-NAME"
            },
            "summary": {
                "mean": 0,
                "max": 0
            },
             "datapoints": [
                {
                    "endDateTime": "2025-05-12T19:28:59.000Z",
                    "value": 0
                },
                {
                    "endDateTime": "2025-05-12T19:34:01.000Z",
                    "value": 0
                },
                {
                    "endDateTime": "2025-05-12T19:36:16.000Z",
                    "value": 0
                },
                {
                    "endDateTime": "2025-05-12T19:42:12.000Z",
                    "value": 0
                }
            ]
        }
    ]
}
Creating Metric Alerts
Use the Stream Alert Rule Management APIs to create events when a metric crosses a defined threshold value. For more information, see Managing Metric Alert Rules
Receiving Metrics in a Sink Integration
Once you have created a stream, and added assets to that stream, you can create a subscription to have metrics sent to your third-party data collector of choice by subscribing to the stream.
Once you create a subscription to the asset(s) metrics, it receives metrics at a 5-minute interval.