Internet Access Inventory
The Internet Access Inventory allows you to view your Internet Access services that are connected to Fabric Ports and Network Edge virtual devices. It is the entry point for managing and monitoring your Internet Access services.
Internet Access services connected to a dedicated port are viewable in your Install Base.
As part of the Platform Updates rolling out to all customers over the course of 2026, Internet Access services over a Dedicated Port will be visible and manageable in the Internet Access Inventory.
Once your account has been onboarded, any Dedicated Port Internet Access service created after your account migration can be managed in the Customer Portal. This includes changing its bandwidth.
Dedicated Port Internet Access services created before your account has been onboarded will still be viewable in your Install Base and will still require a Move, Add, Change, or Delete request to customer support to modify. See Managing Dedicated Port Services for more information.
Equinix Connect services are not available in the Internet Access Inventory; use Orders & Ticket History instead.
To access your Internet Access Inventory:
-
Sign in to the Customer Portal
-
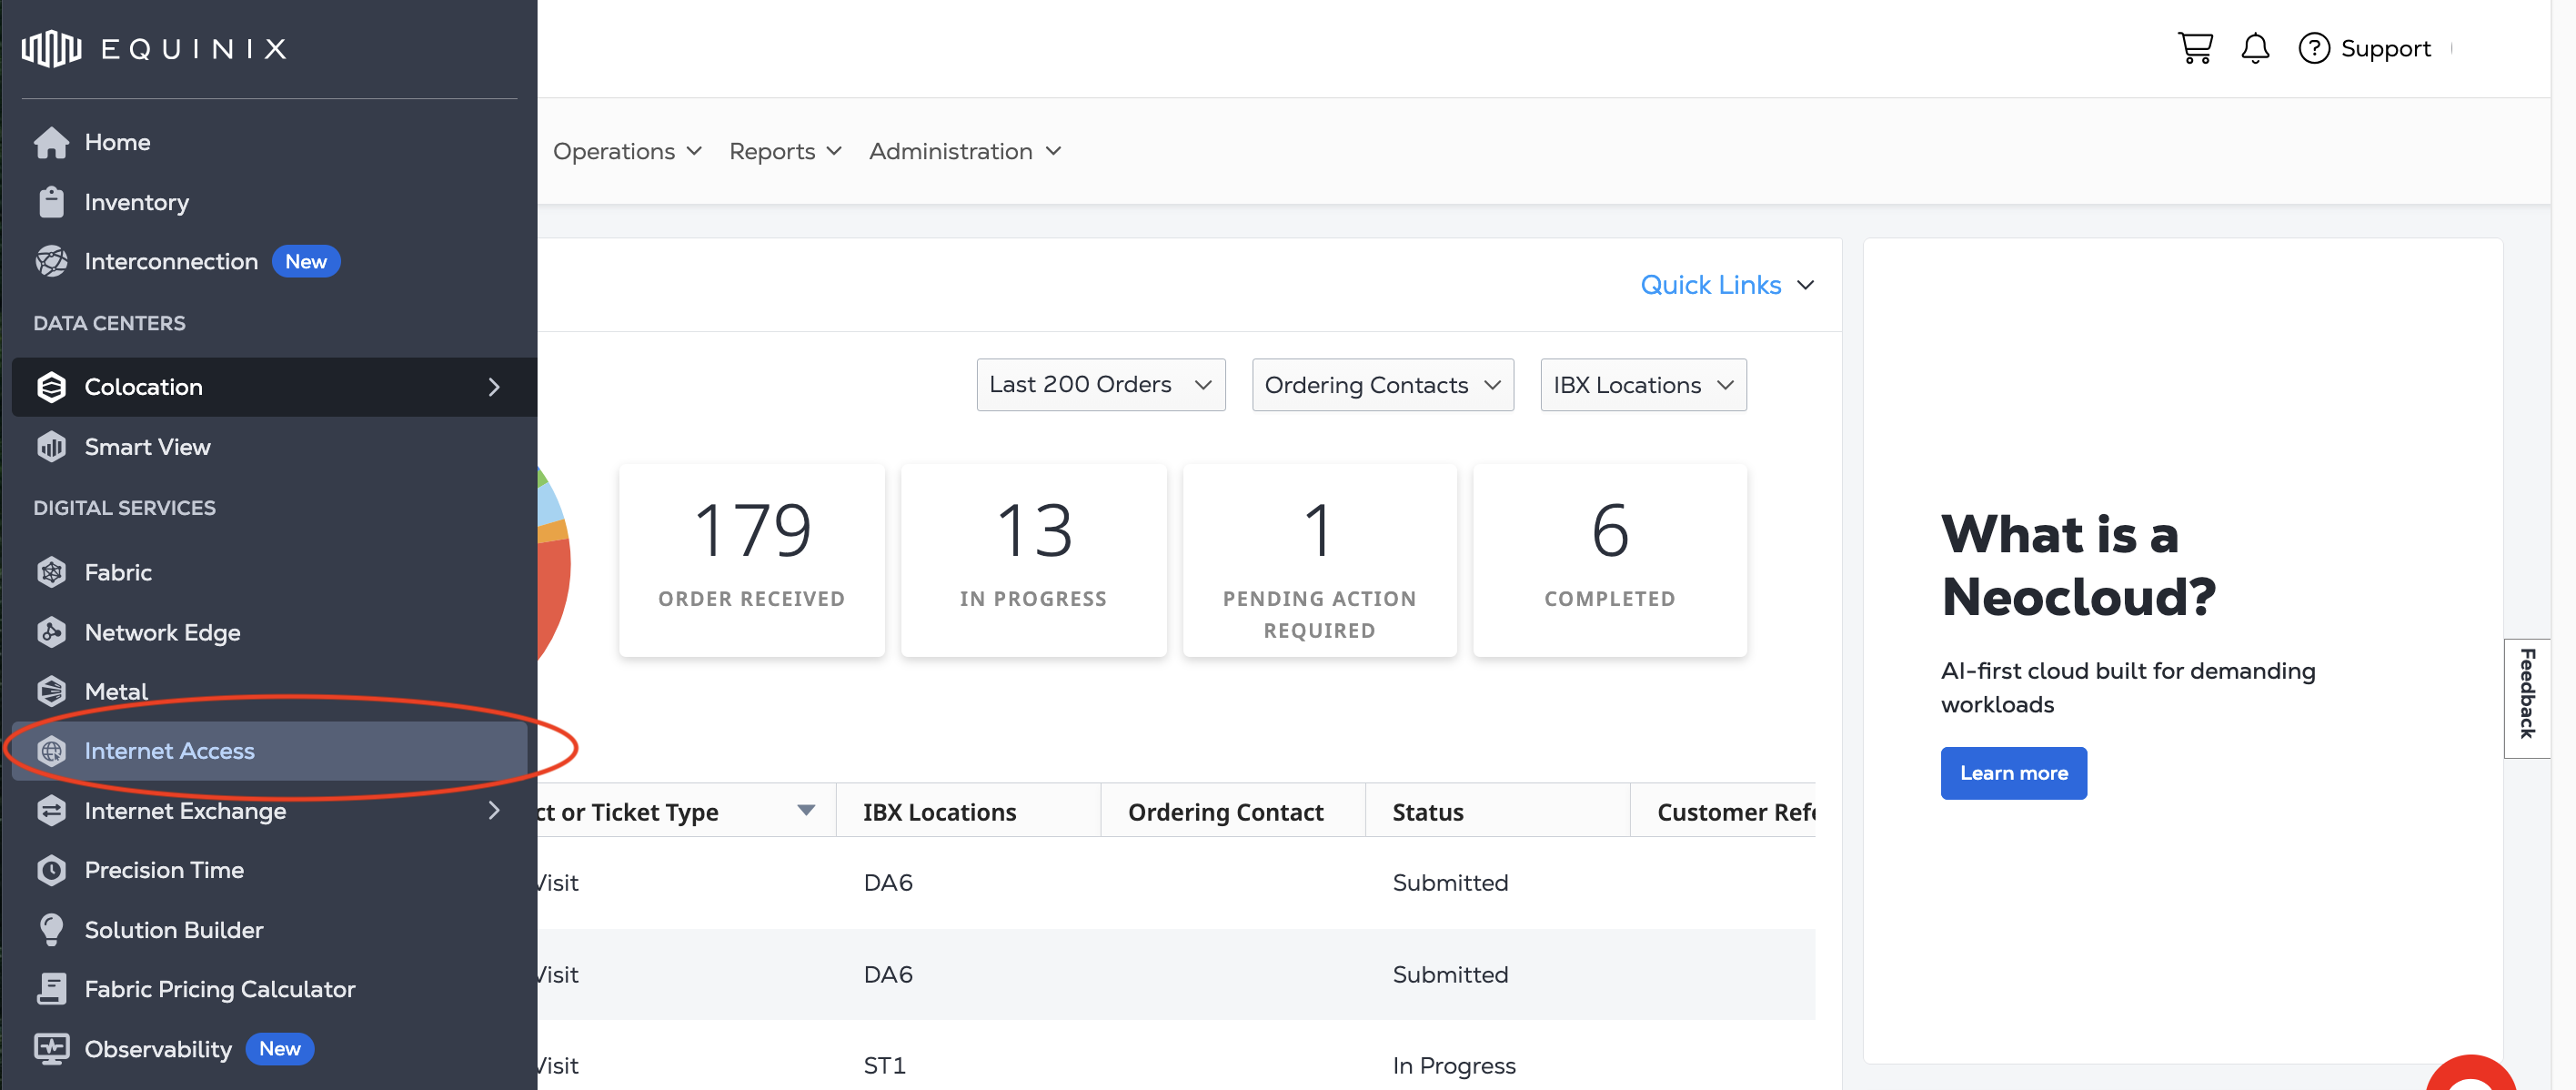
From the global navigation menu, select Internet Access.
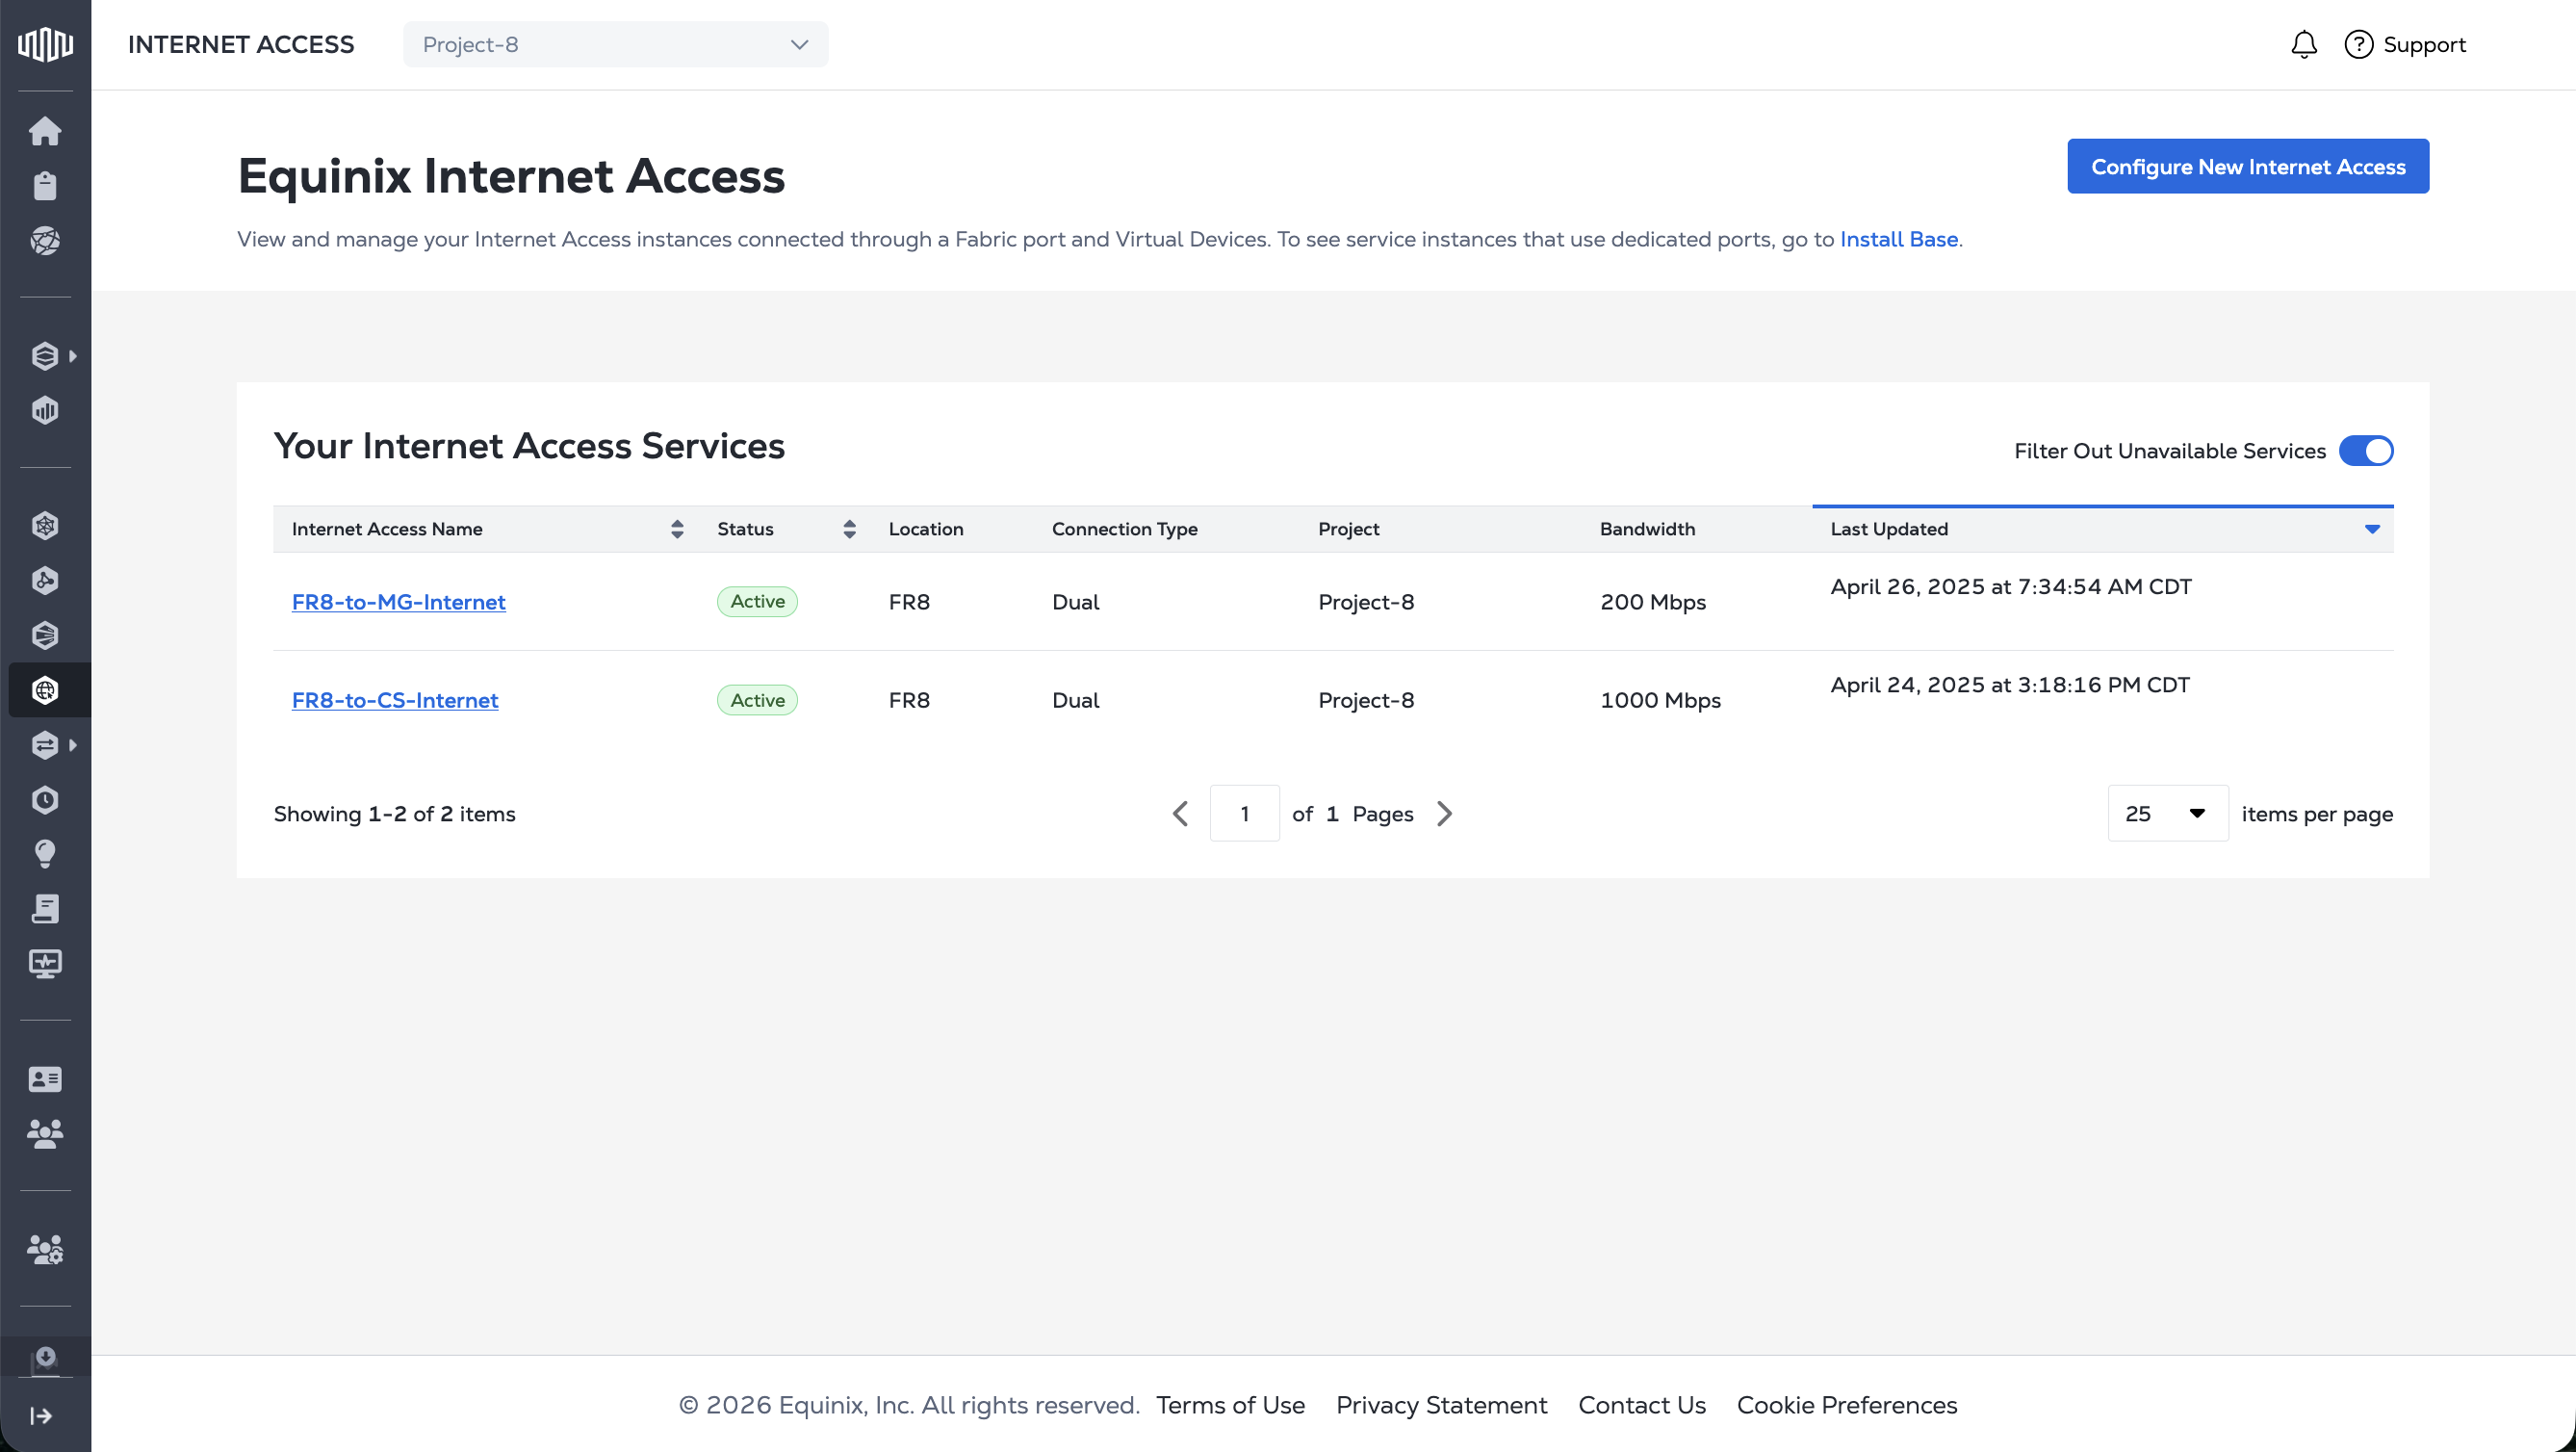
Your Internet Access Services
The table presents a comprehensive service overview of your Internet Access services, including:
- Status - Possible status values are: pending, provisioning, active, inactive, deprovisioning, deprovisioned, and failed.
- Location - The IBX location of the service.
- Connection Type - Indicates whether the service is using single or redundant connections.
- Project - The project that the service resides in.
- Bandwidth - The bandwidth of the service's connection.
- Last Updated - Date and timestamp of the last time the service was updated.
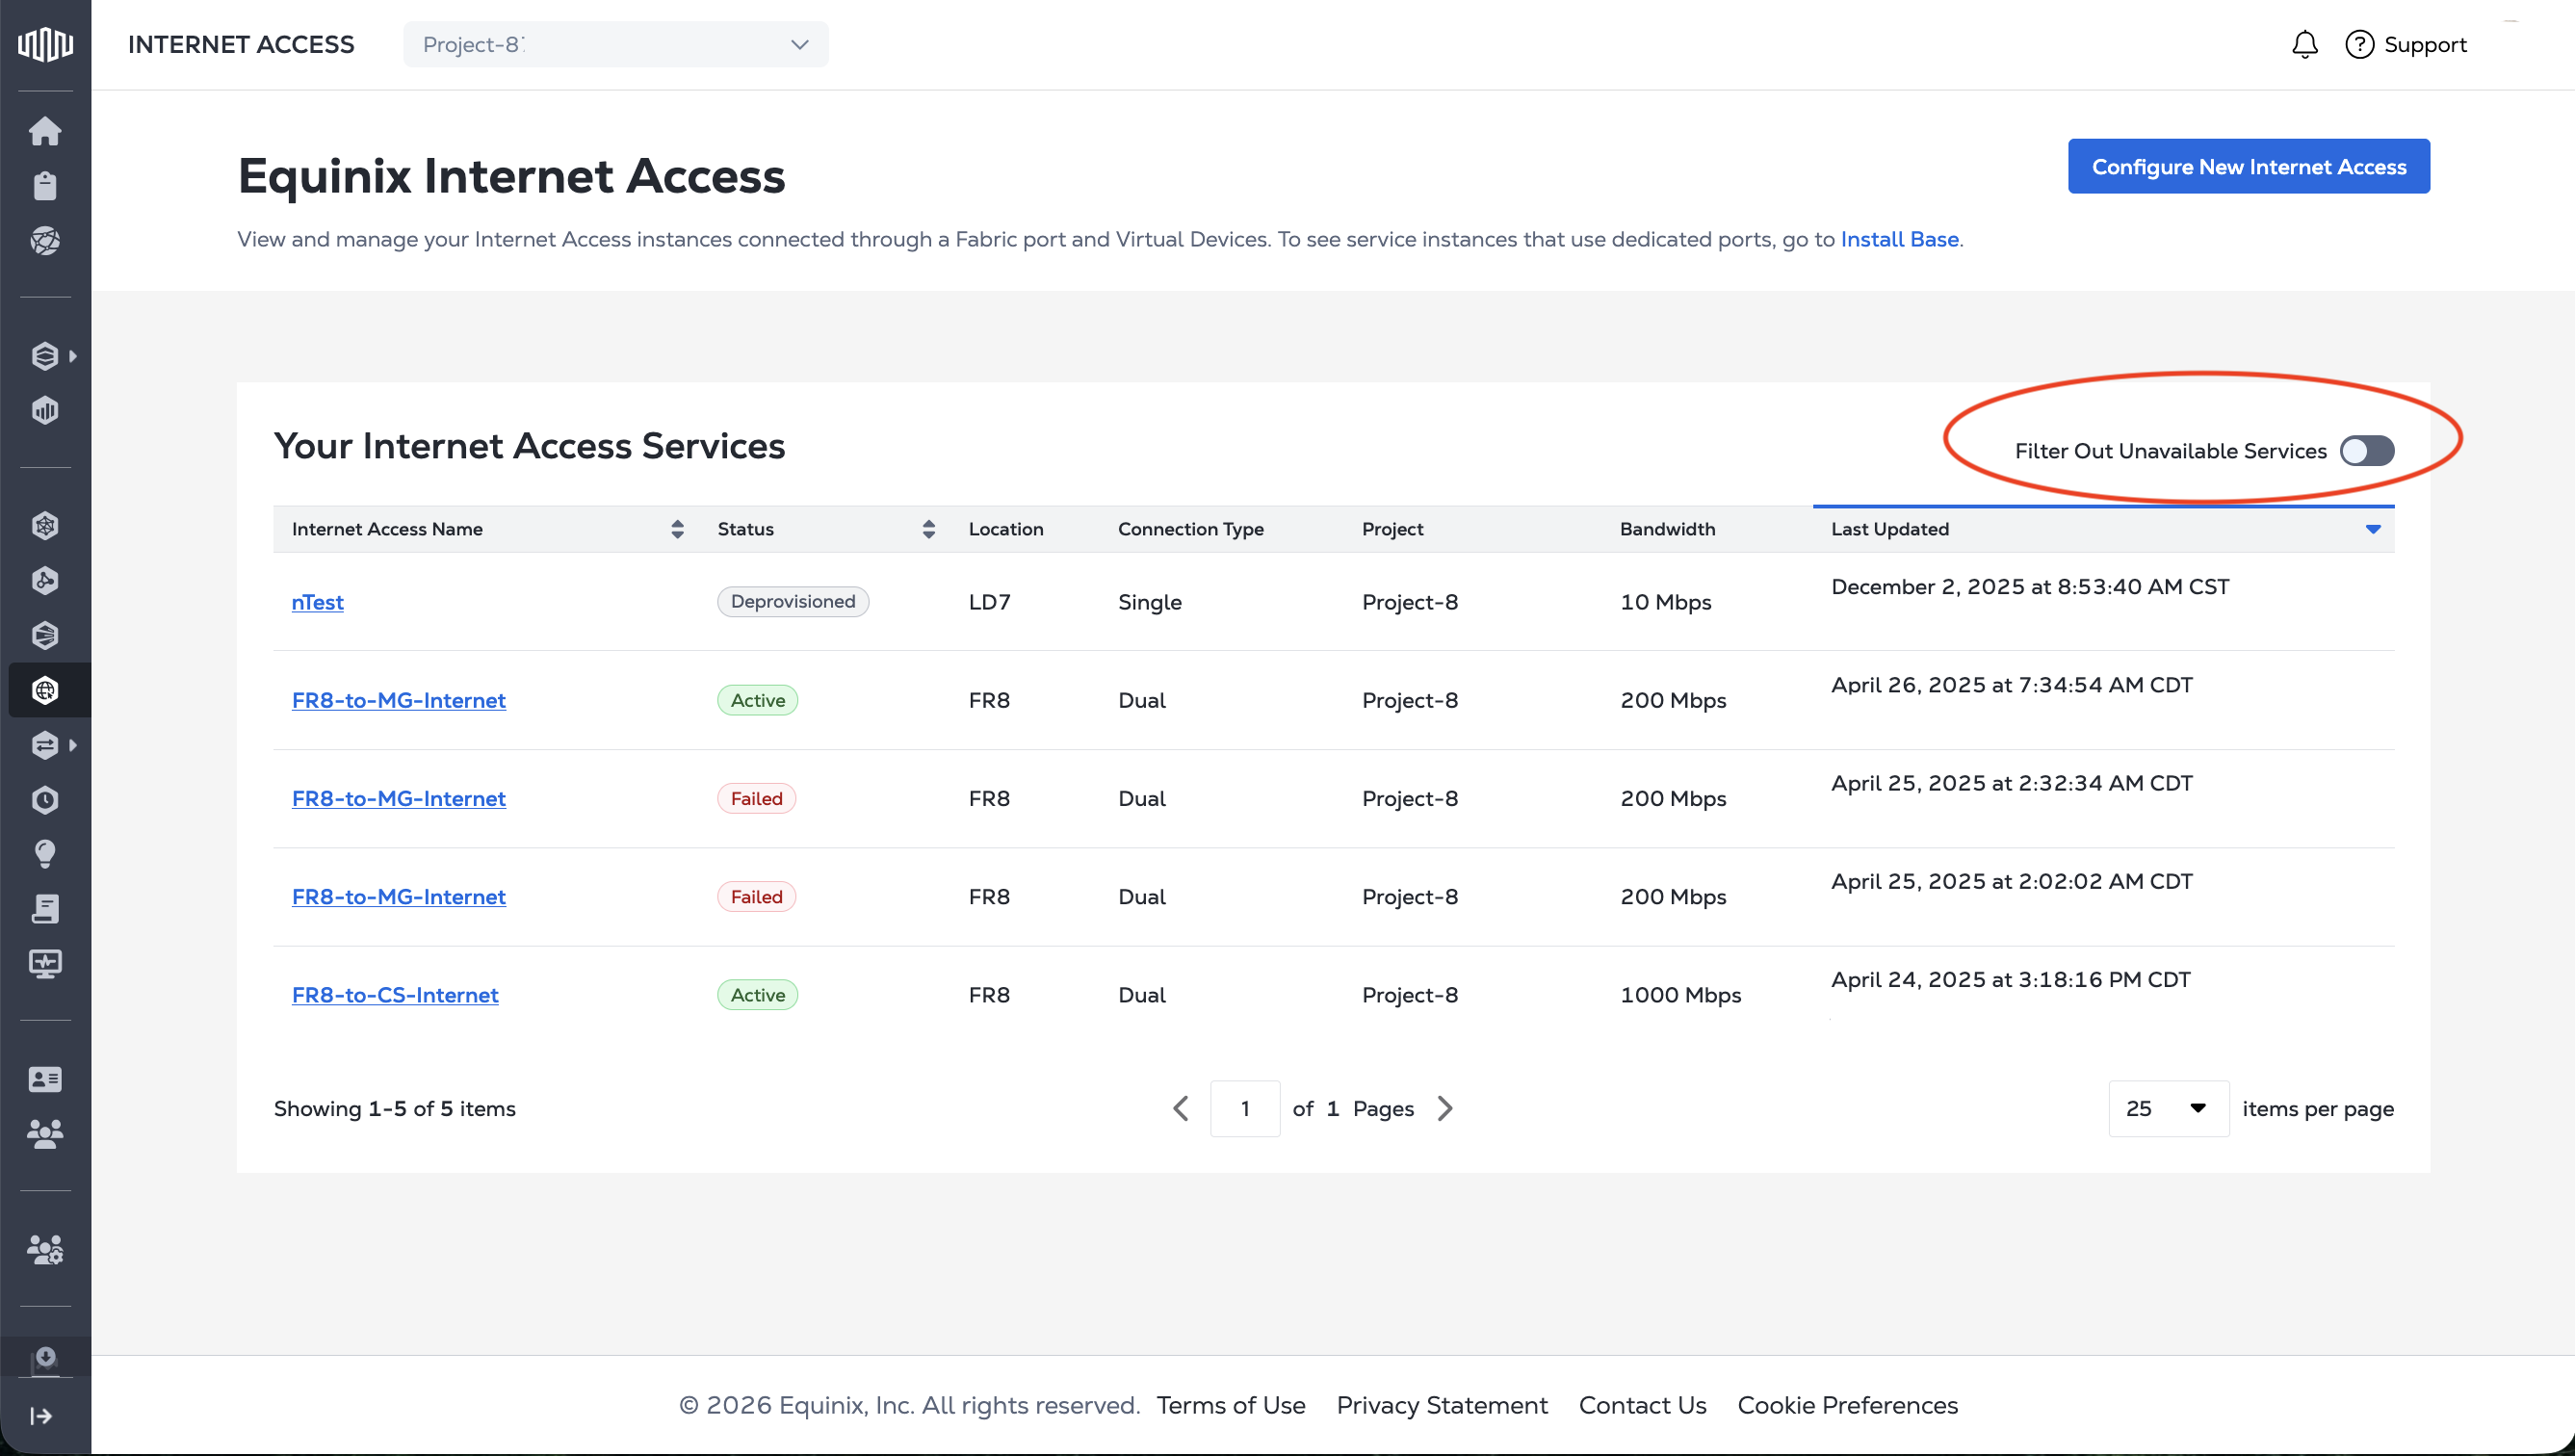
Use the Filter Out Unavailable Services toggle to show or hide services that are inactive, deprovisioned, or failed.
View Details
To view details for a service, click an Internet Access service's name. The details such as its configuration, billing type, IP addresses, and order details are displayed.
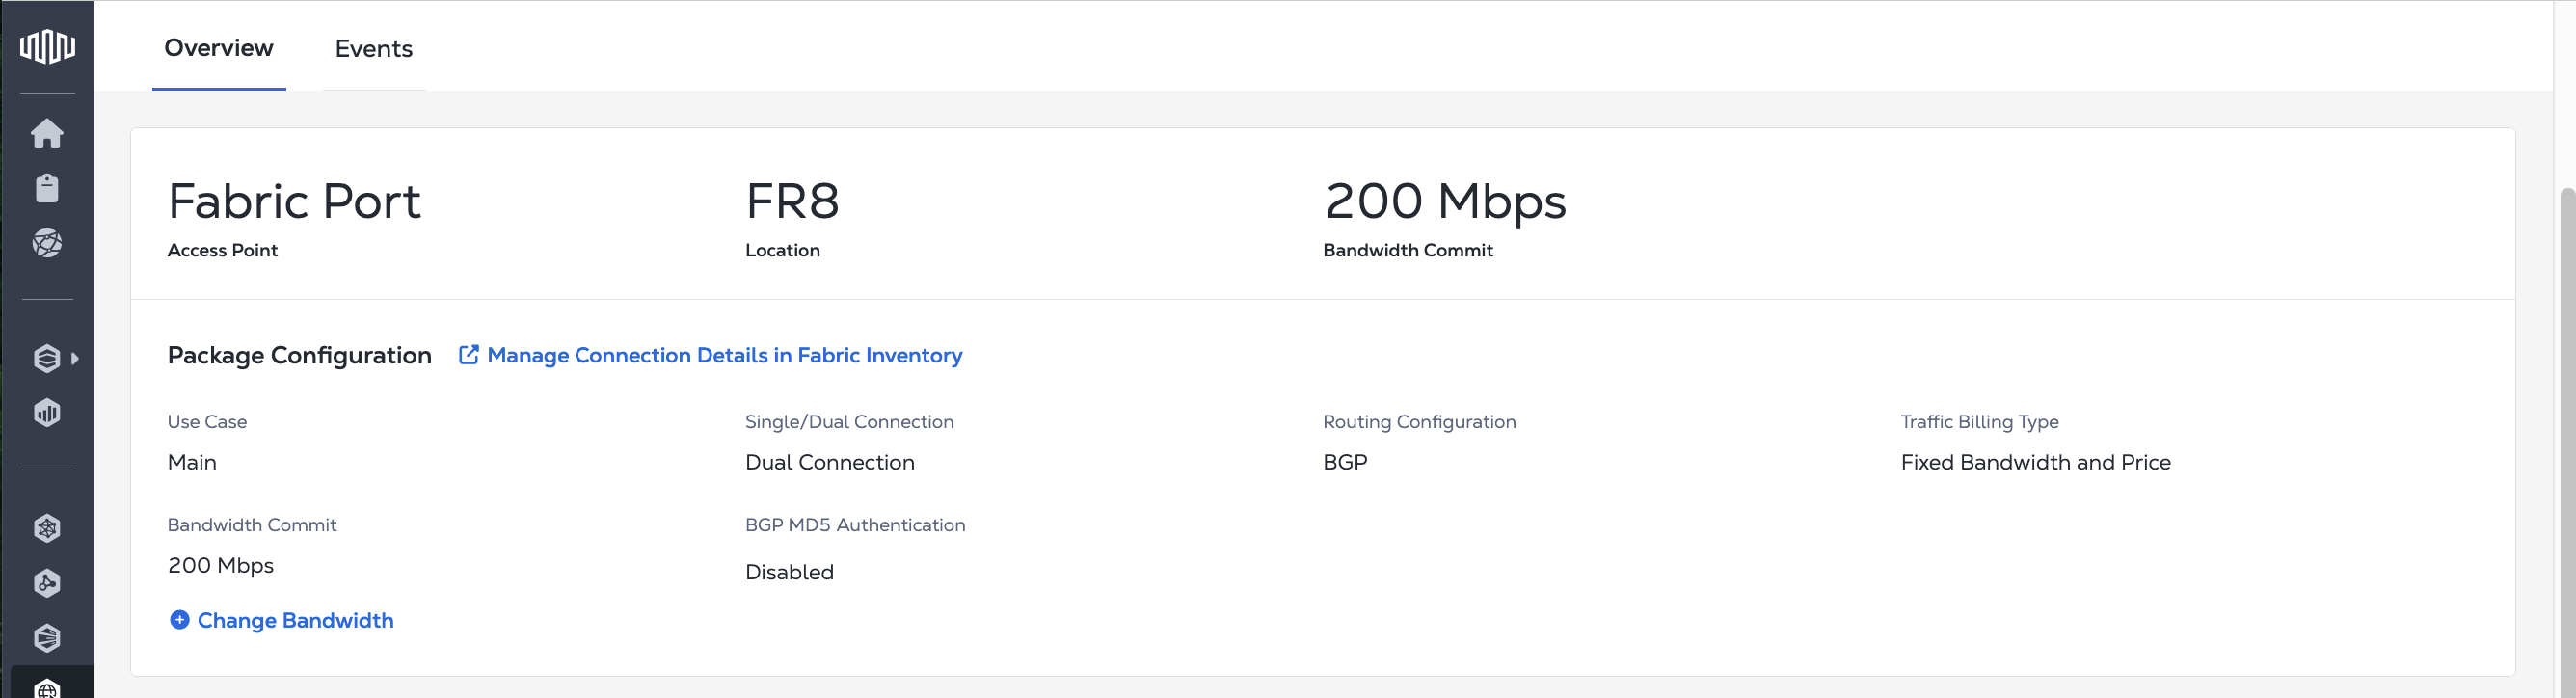
Overview
The Overview tab provides detailed configuration information. For each service, you can view the access point, location, and bandwidth commit, as well as:
-
Package Configuration - The Package Configuration panel contains the details of your service's connection, including bandwidth, ports, routing, and traffic billing type.
- To see even more information on the connection, click Manage Connection Details in Fabric Inventory which opens the connection's details in your Connections Inventory.
- To manage your bandwidth, click Change Bandwidth. For more information, see Manage Bandwidth
-
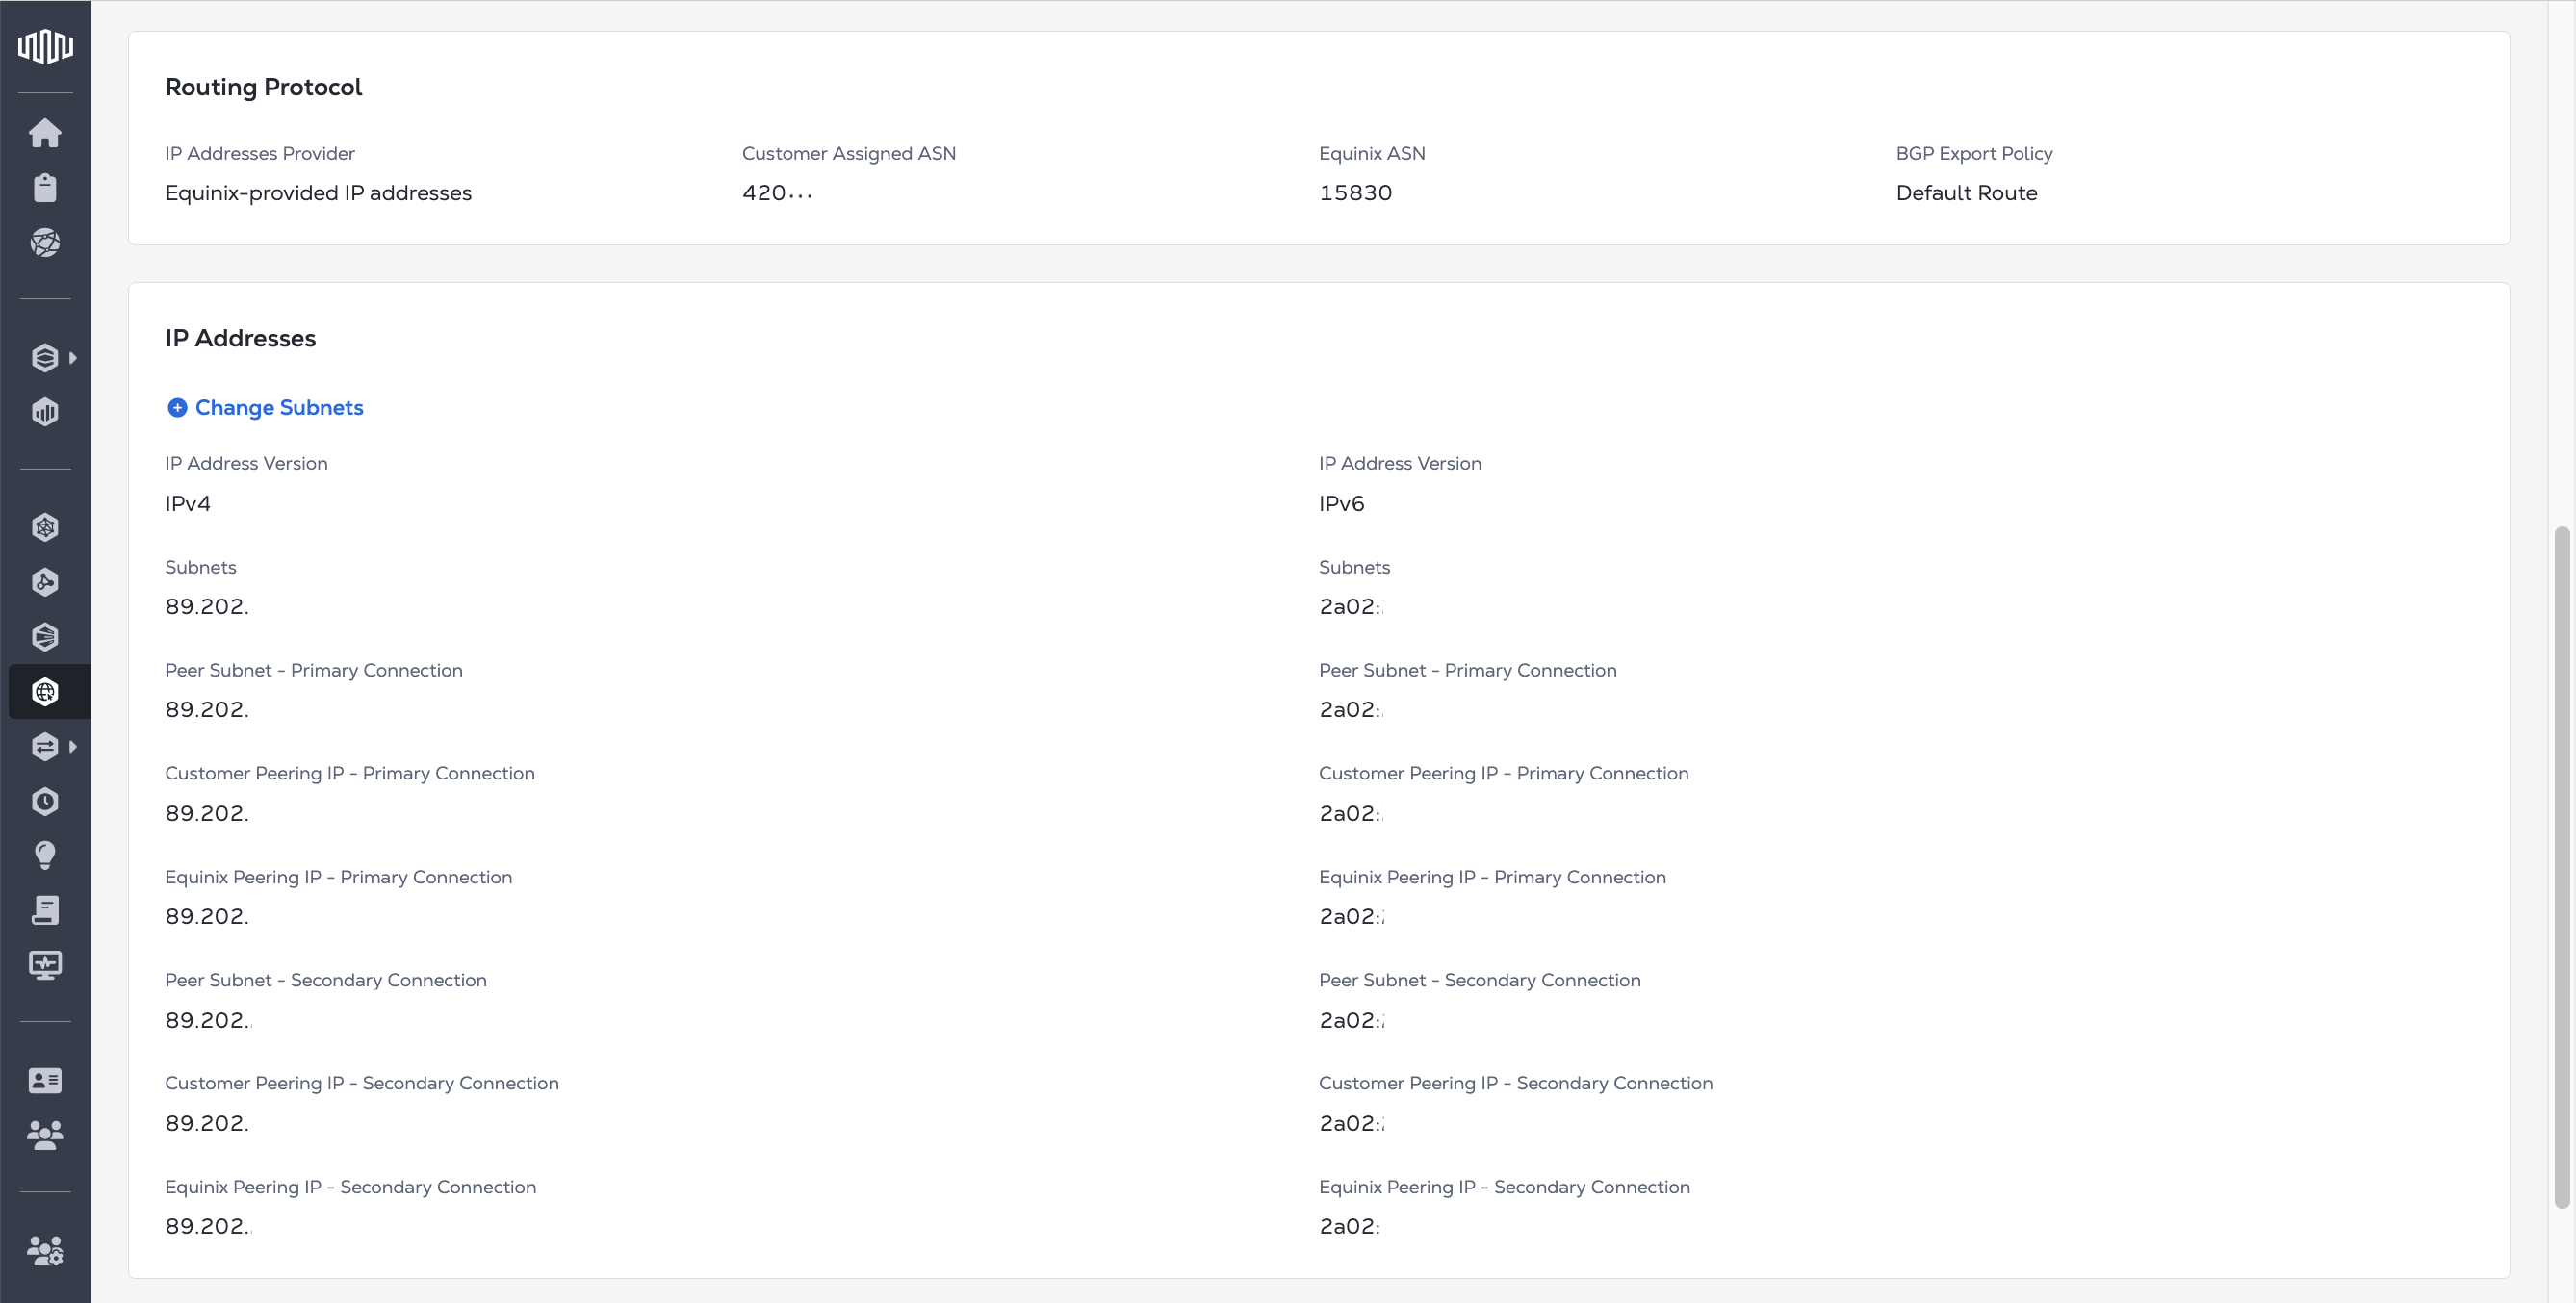
Routing Protocol - The Routing Protocol panel contains details about your routing configuration, your IP addresses provider, and ASN information.
-
IP Addresses - The IP Addresses panel contains your IP address, IP block, and IP subnets. To manage your IP blocks, click Change Subnets. For more information, see Manage IP Blocks (Add / Delete)
-
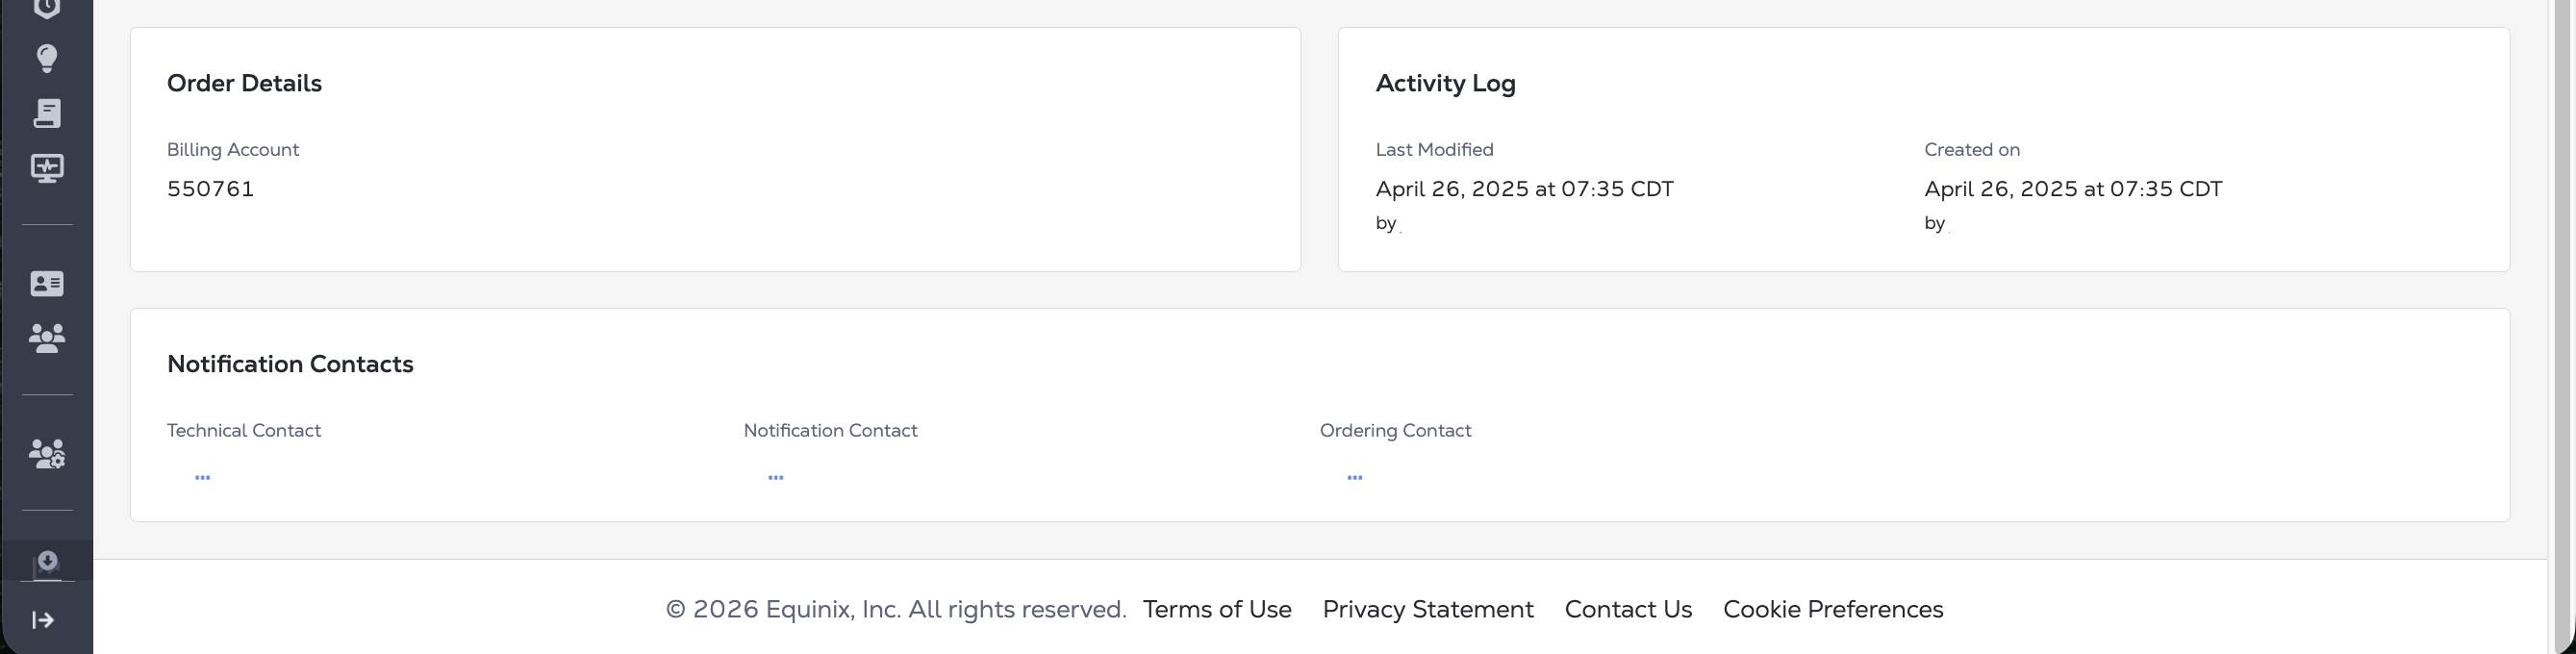
Order Details - The Order Details panel contains the Billing Account information for this service.
-
Activity Log - The Activity Log panel contains the date and timestamp for when the service was created and when it was last updated.
-
Notification Contacts - The Notification Contacts panel contains the contact email address for the technical contacts, notification contacts, and ordering contacts for this service.
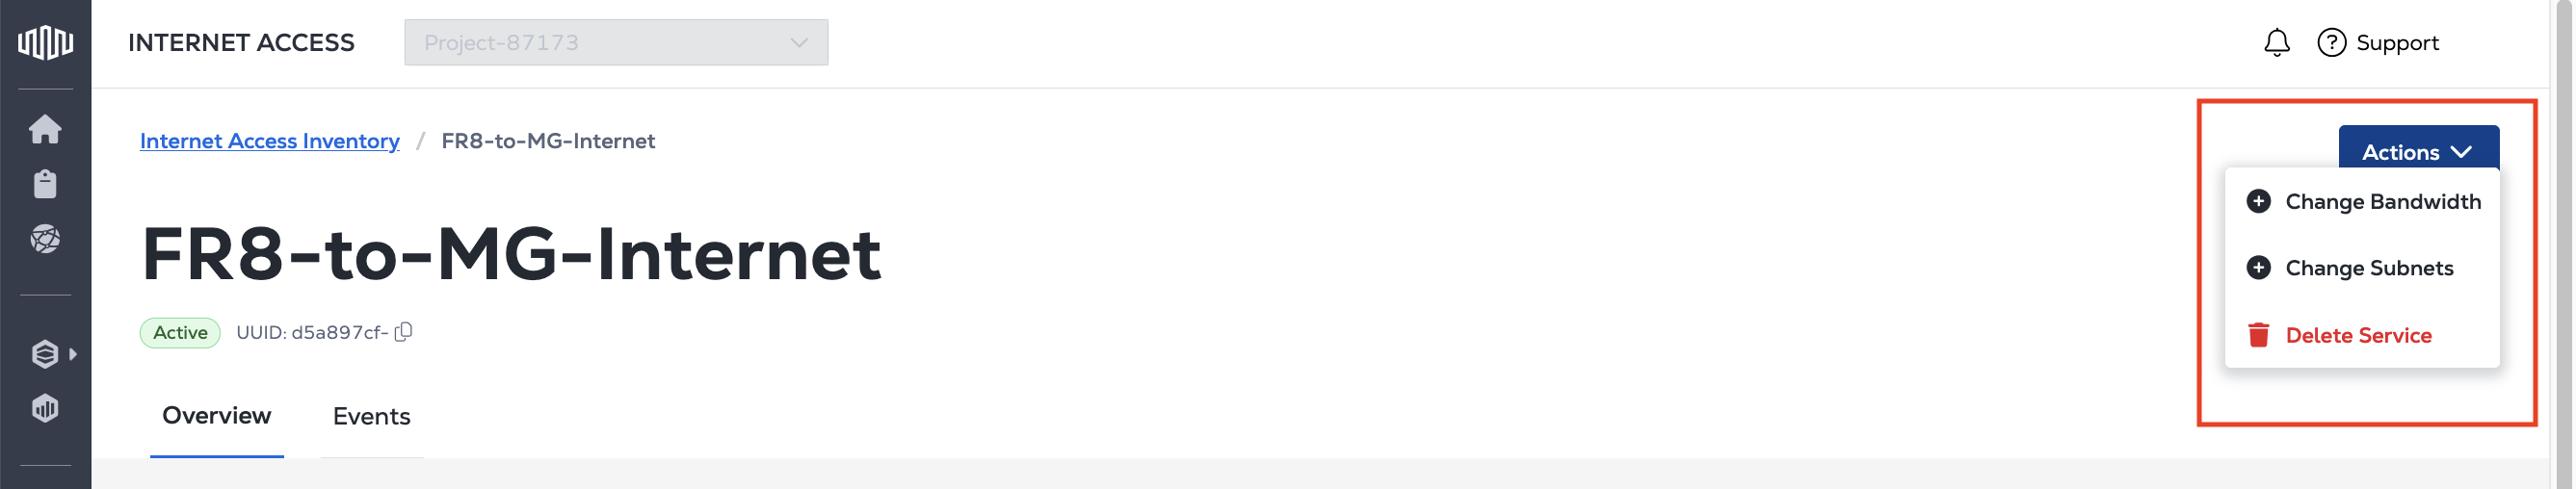
Use the Actions drop-down to manage your service. You can use it to:
Events
The Events tab shows the lifecycle events for this Internet Access service. Any status change to your service, including provisioning, deprovisioning, and failures, results in an event being sent.
The Equinix API offers the ability to create and customize a stream that collects usage data for your connection or connections. Once you have created a stream you can view the events data from the Equinix API or create a subscription to have the data sent to your data collection platform.
To configure connection monitoring from the API:
To get your data, either:
- Retrieve the data from the Events API endpoint.
- Create a subscription and send the data to a data collector.