Incident Details
Click an incident in the Latest Incidents section or the Geographical View to open Incident Details. View information such as the incident title, type, service-impacting state, timestamps, and location data. Review the incident details and bullet list for additional information, and view assets associated with the incident.
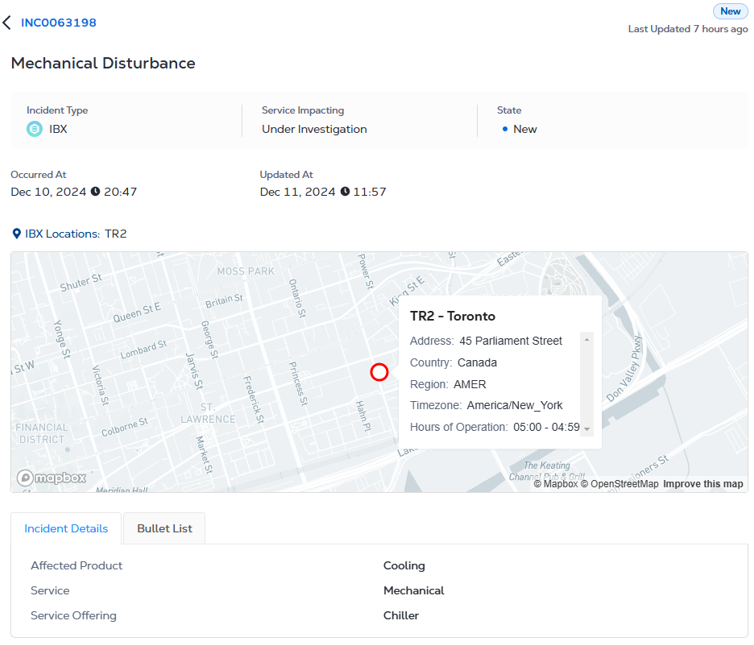
You can also access this view by clicking on an incident title from the Incident list or the health card.
The incident detail screen shows:
-
Service Impacting - Whether Equinix-delivered services are/were impacted by the incident (Yes or No).
-
State - Current status of the incident (New, Updated, or Resolved).
-
Occurred at - Date/time the incident occurred.
-
Updated at - Date/time the incident was updated.
-
Resolved - Date/time the incident was resolved.
-
Incident Type - The incident type (IBX, Network, ESH or Security).
-
Incident Number - A unique ID for the incident.
-
Affected Products - Such as Equinix Connect, Internet Exchange, Metro Connect, Colocation, Equinix Precision Time, etc.
-
IBX Locations - The affected data center sites.
-
Service - (IBX incidents only) Electrical, Mechanical, Cross Connect, or Location.
-
Service Offering - (IBX incidents only) Such as a cage number or other asset ID.
-
Affected Assets & Accounts - The account numbers and names of the customers affected by the incident. To find a specific name or number, use the search box. To sort the list, click a column header.
-
Notifications
-
The right side of the window shows all updates to the incident, sorted by date/timestamp:
- The first update for an incident.
- Subsequent updates for an incident.
- Details about the resolution of the incident.
-
To toggle the sort order of the updates, click the Sort by drop-down and select Latest or Oldest.

tipYou can use your computer's Find function (for example, Ctrl + F for Windows) to search for specific text in the incident update messages.
-
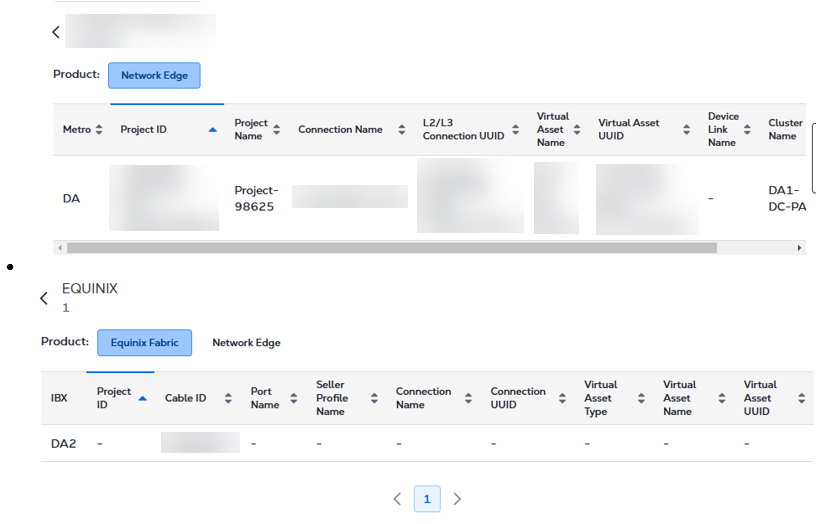
Affected Assets
The Asset section displays all the assets affected for a specific incident. The details provided in this section may vary based on the type of product.
Incident Resolution
The Incident Resolution section lets you view and download closure reports for resolved or closed incidents approximately one business day after resolution. You can also submit Post-Incident Report (PIR) requests, track their progress through each stage, and view or download the finalized PIR reports once they are published in Equinix Service Insights (ESI).
Incident Resolution is currently available only for IBX Ops, Security, Environment, Health and Safety Incidents. Support for Network Incidents is not currently available and is planned for a future release.
Closure Reports
Closure reports provide resolution details for incidents, including the identified root cause, its impact, and the recommended or corrective actions taken. View and download closure reports directly from Equinix Service Insights (ESI).
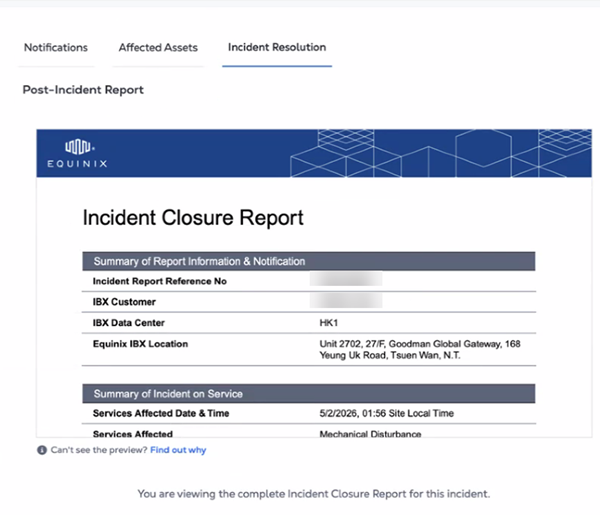
Closure reports and PIR requests are only available approximately one business day after an incident is resolved.
Hover over the closure report to view or download.
Post-Incident Reports
Request a Post-Incident Report (PIR) to obtain a more detailed, customer-specific report. After the PIR team begins work on the request, the PIR progresses through the next stage. The following stages outline the PIR lifecycle, from request submission through final publication in Equinix Service Insights (ESI).
- Requested – PIR is requested and waiting for the PIR process to be initiated.
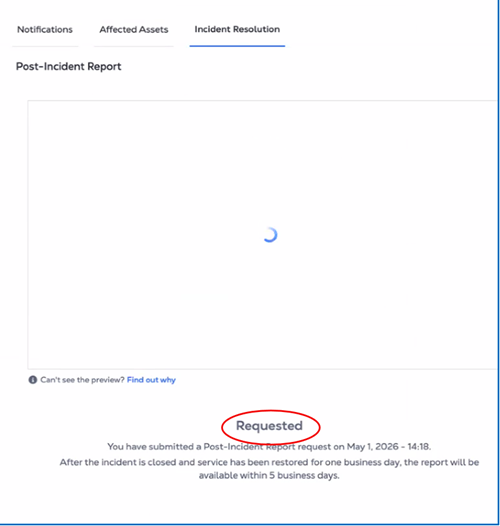
- In Progress – PIR preparation is in progress.
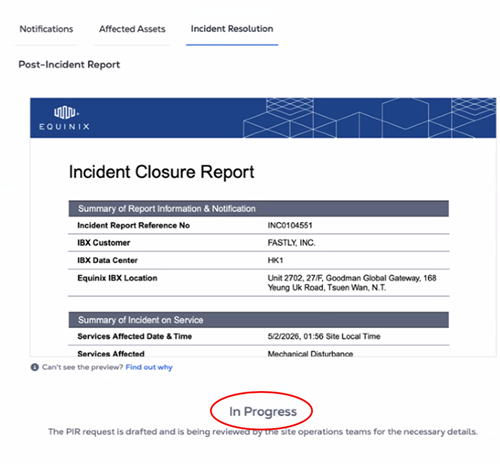
- In Review – PIR is progressing through the approval process.
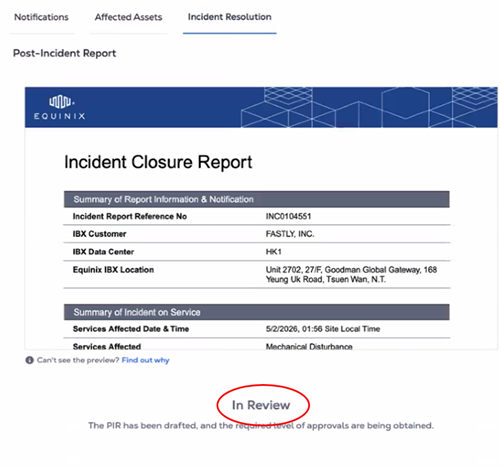
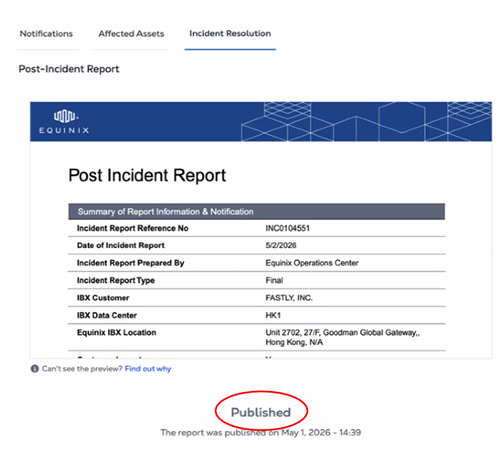
- Published – PIR is completed and published in ESI for the customer access.
- Cancelled – PIR request was cancelled.
The finalized PIR will be published in ESI within five business days of the request being submitted.
Support Center Integration with Service Insight
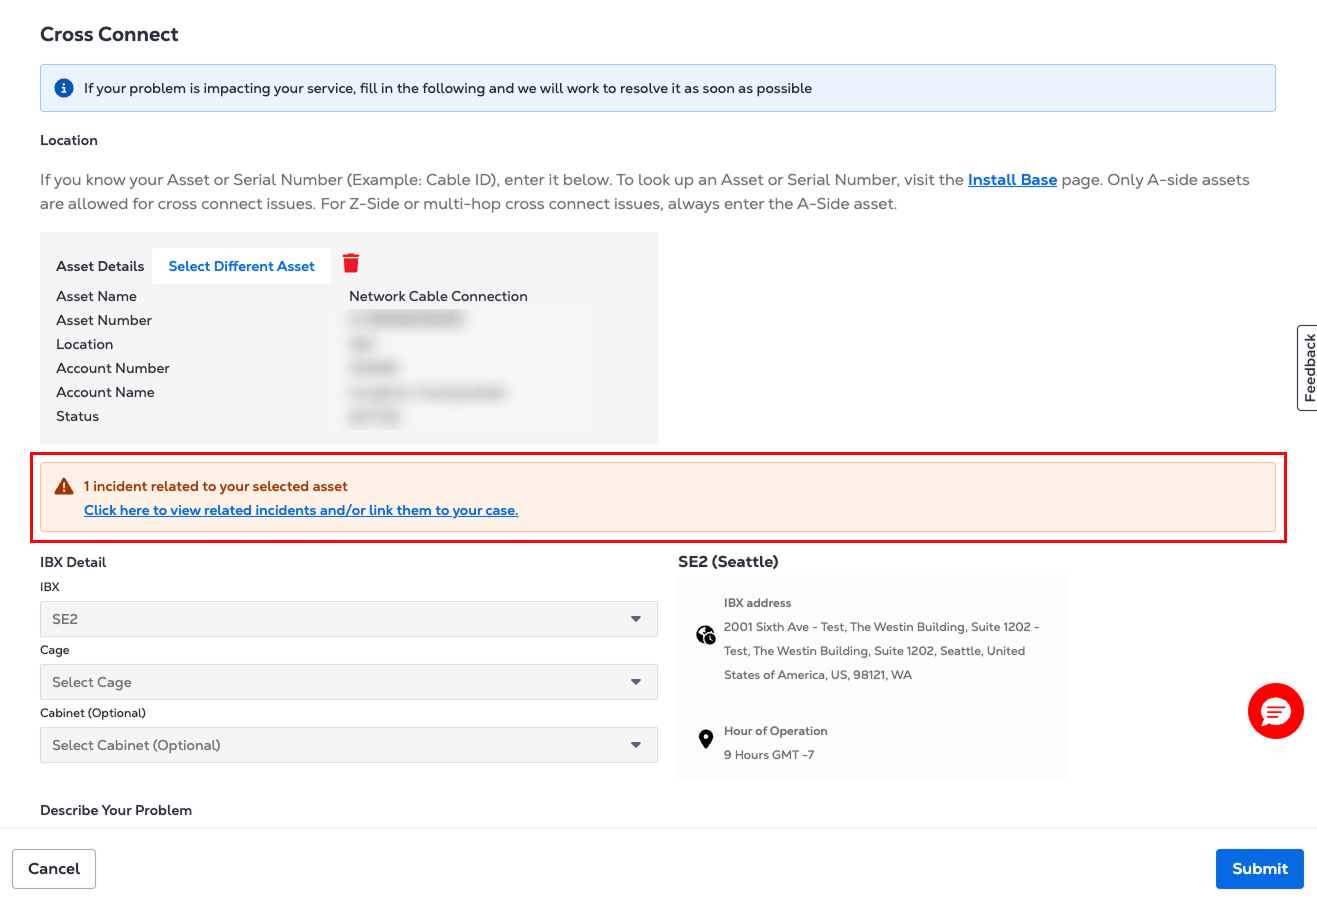
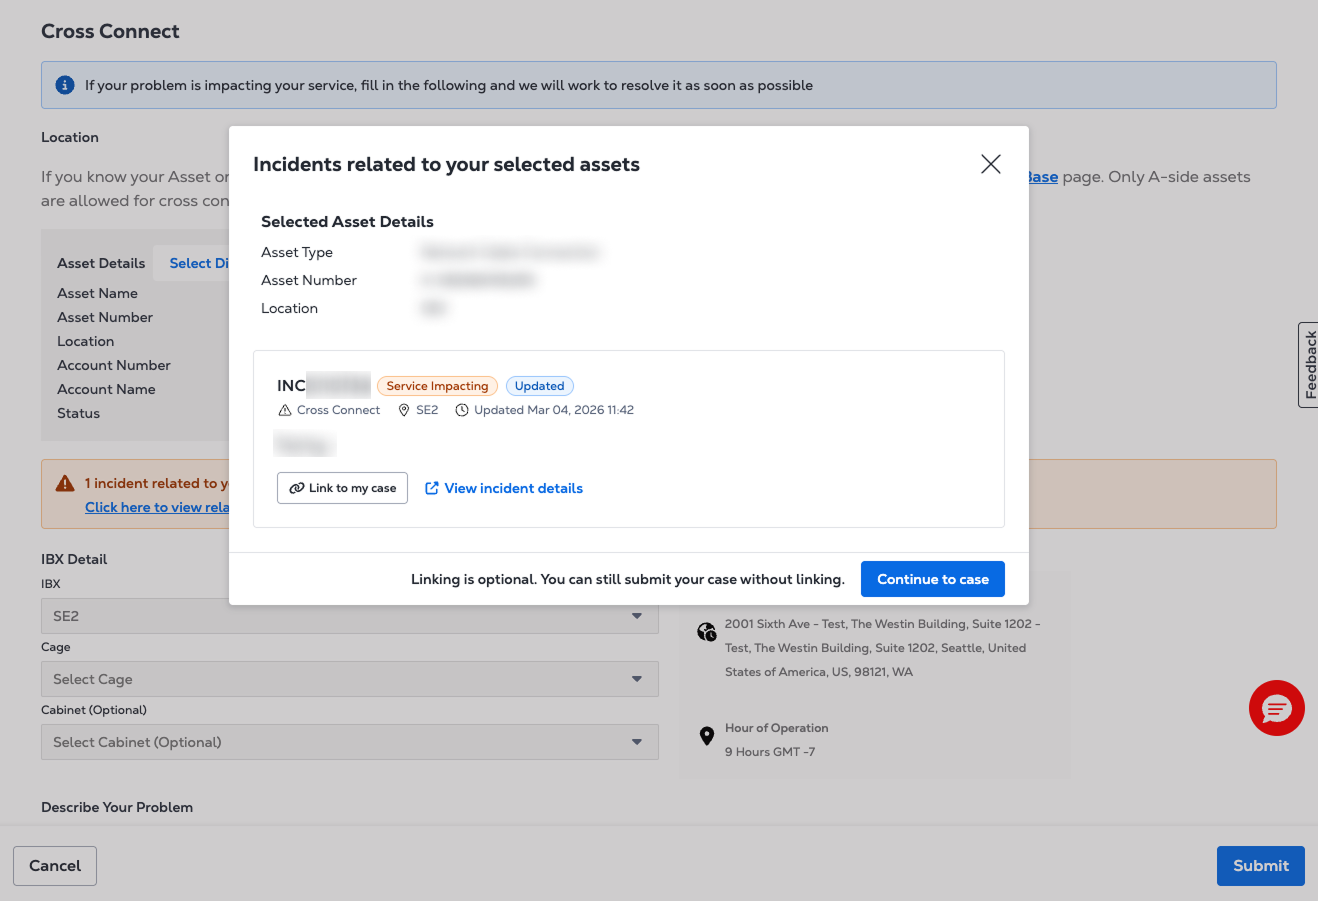
When selecting an asset or IBX data center during case submission, a banner appears if there is an active incident associated with that asset or IBX data center. The banner displays a summary of the incident and its current status. Select Link to my case to associate the case with the incident. If no related incident is found, or if the incident service is temporarily unavailable, case submission continues as normal.
For more information about submitting a support case, see Opening a Support Case.