Service Insight Dashboard
The Service Insight Dashboard provides a central location to view any IBX-related or product-related incidents that may affect you.
Accessing Service Insight
To access Service Insight, you need:
-
Credentials for the Customer Portal. If you need to create an account, see New Customer Onboarding
-
Customers have organization-level visibility into Service Management tickets, including Incidents and Change Requests, and can view tickets that affect any account associated with their organization.
Customer Portal
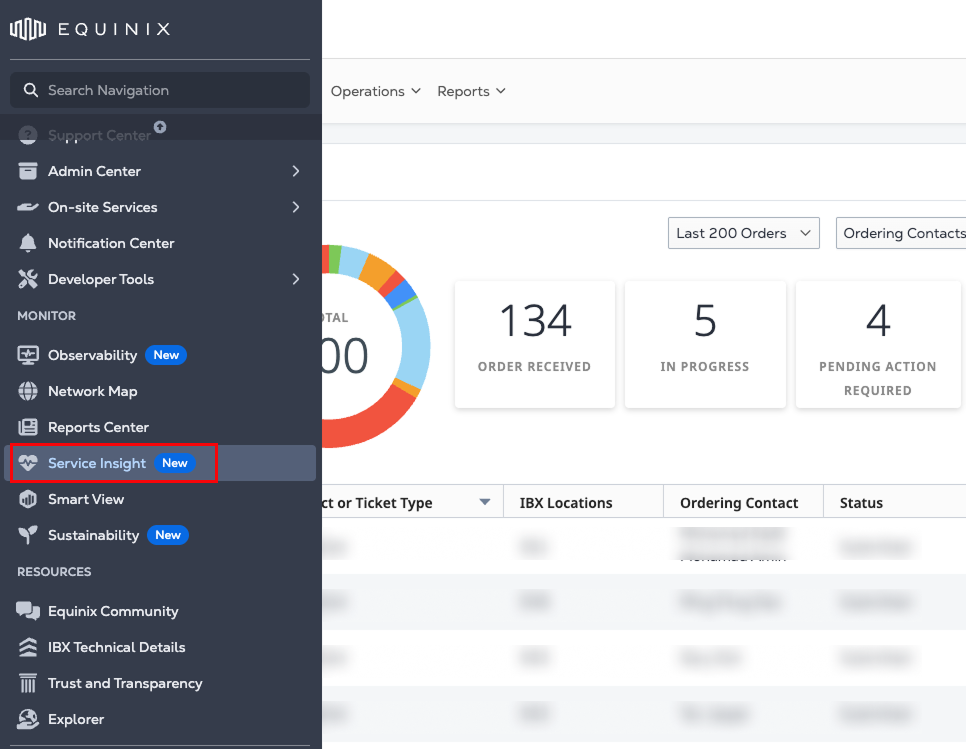
To view the Service Insight dashboard, select Service Insight from the global navigation menu:
Email Notification
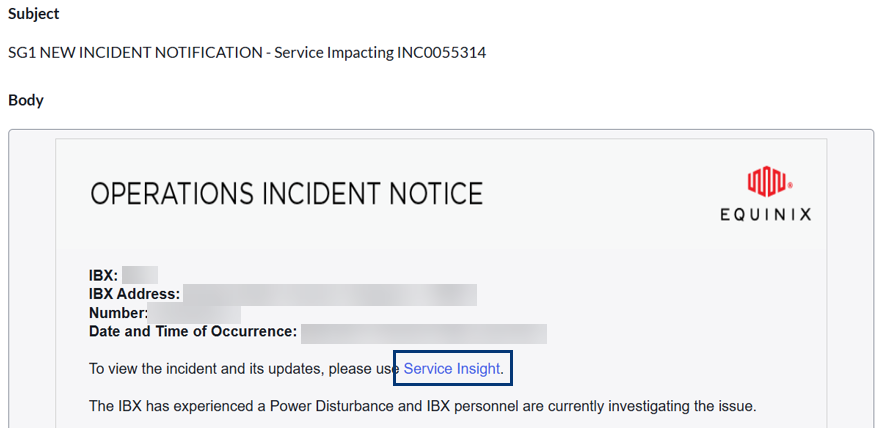
If you received an incident notification email, click Service Insight from the email.
- If prompted, sign in to the Customer Portal.
Dashboard
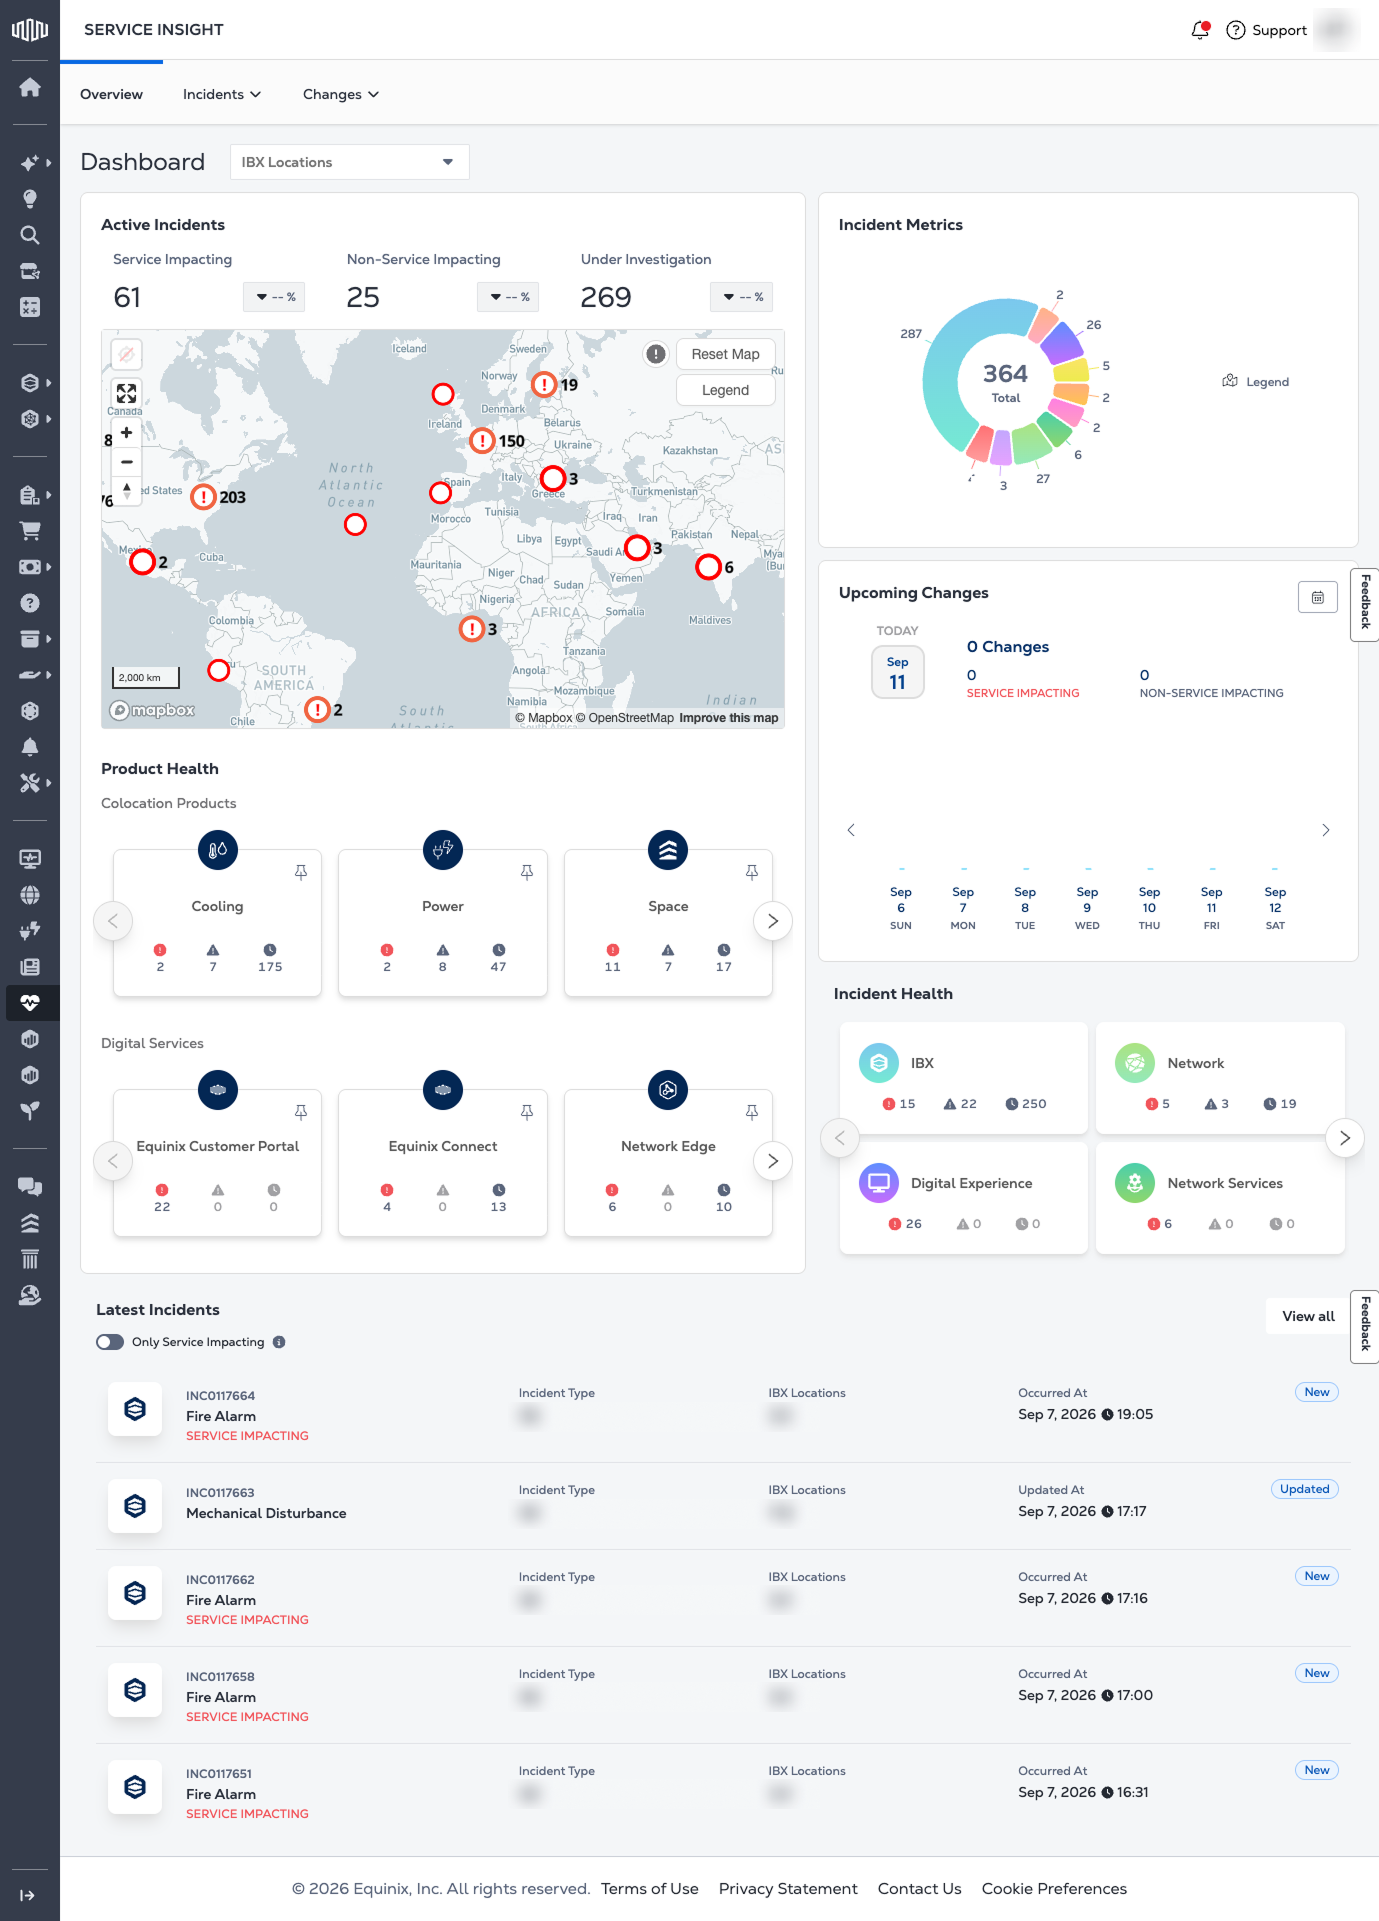
The Dashboard provides a high-level view of your services and incidents.
Active Incidents
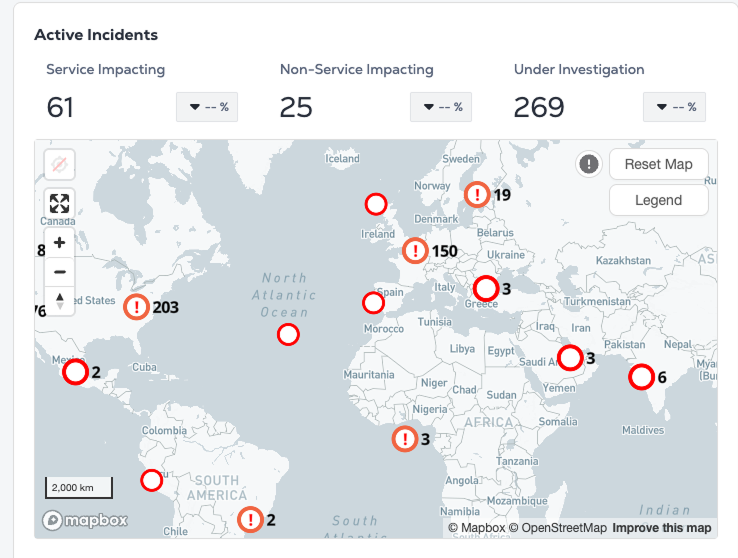
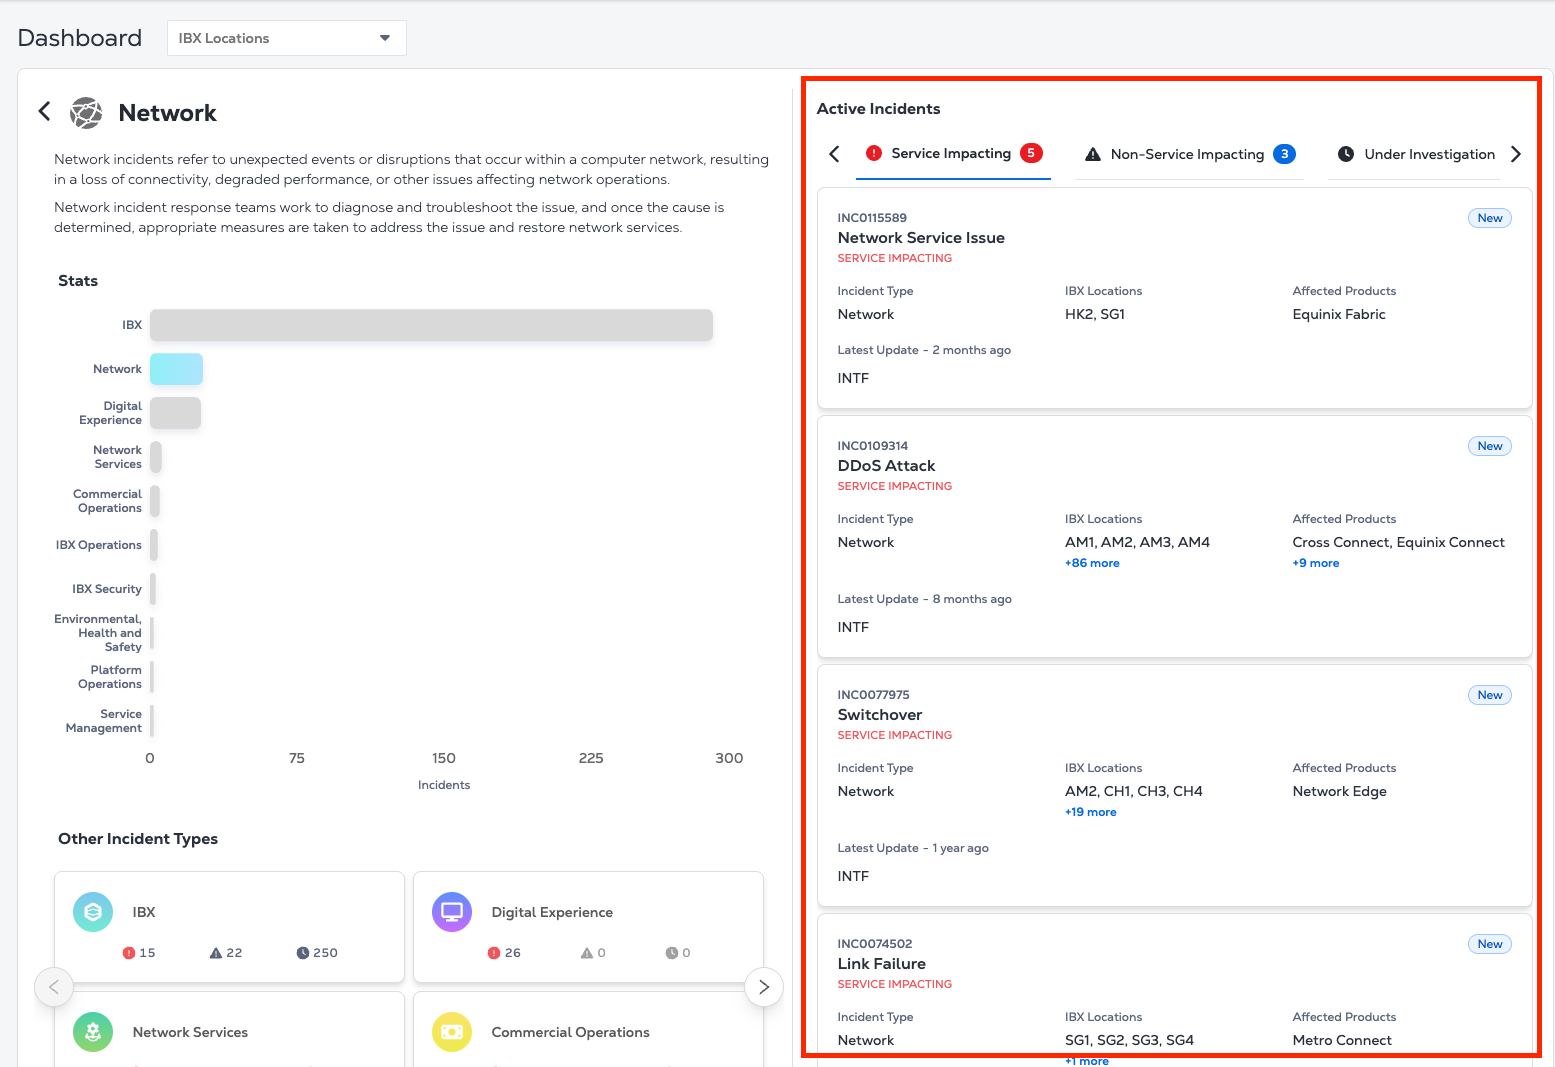
The Active Incidents section displays a listing of active issues categorized as Service Impacting, Non-Service Impacting, and Under Investigation. You can see the daily change in incidents, indicating whether there has been an increase or decrease in instances.
Incident Types:
-
Service Impacting - A service-impacting incident is one that affects the Equinix services delivered to you. (It does not refer to the customer’s service status.)
-
Non-Service Impacting - A non-service-impacting incident is one that does not affect Equinix-delivered services. Equinix service is confirmed to be available or restored.
-
Under Investigation - Incidents that are still under investigation
noteExamples of incidents that do not impact services:
- The main server is under repair, but backup servers continue to support services, preventing service impact.
- The main communications link between two IBXs is down, but an alternate link continues to carry traffic, preventing service impact.
In the Geographic View, incidents appear as circles on a map that indicate their location.
- An exclamation point identifies a service-impacting incident.
- Zoom in to decluster incidents and click a location to view a breakdown by Metro.
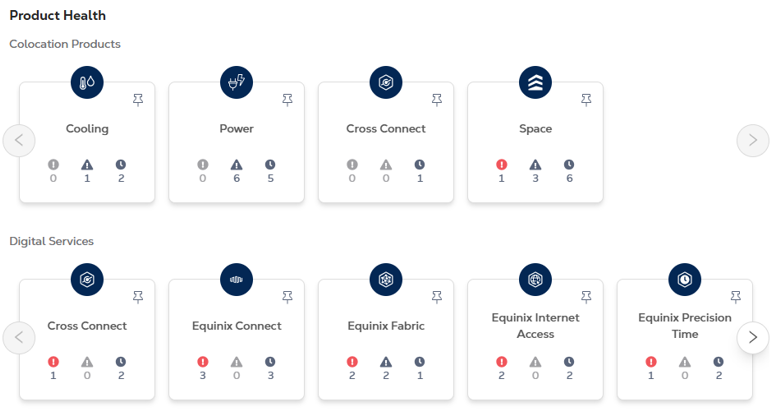
Product Health
The Product Health section provides insights into your colocation and digital services. Colocation incidents are grouped by issue classification to provide a product-focused view. Click a category to view a breakdown of affected services and current incidents.
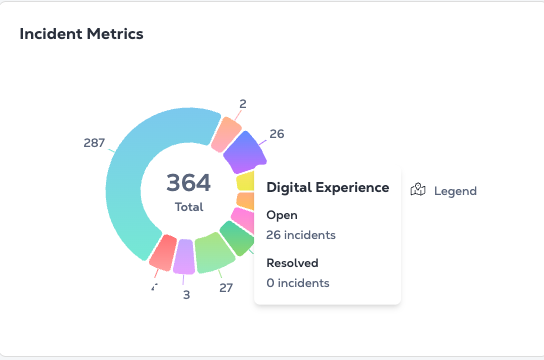
Incident Metrics
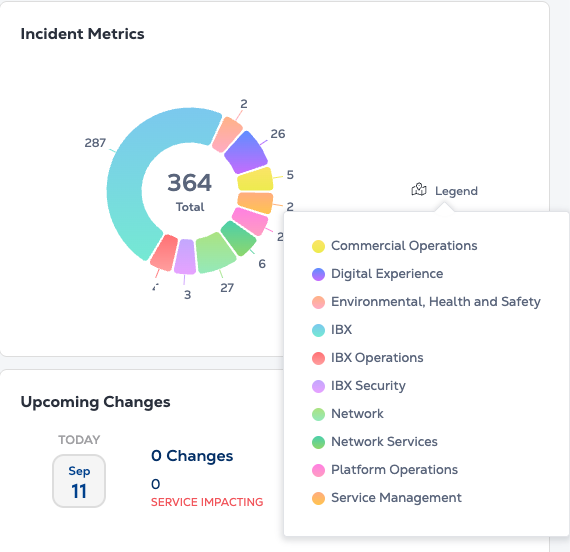
The Incident Metrics section gives you a quick overview of incidents by type. You can view the ratio of IBX, network, security, and EHS incidents at a glance. Hover over a metric to see additional details.
Hover over Legend to view the color-coded incident categories.
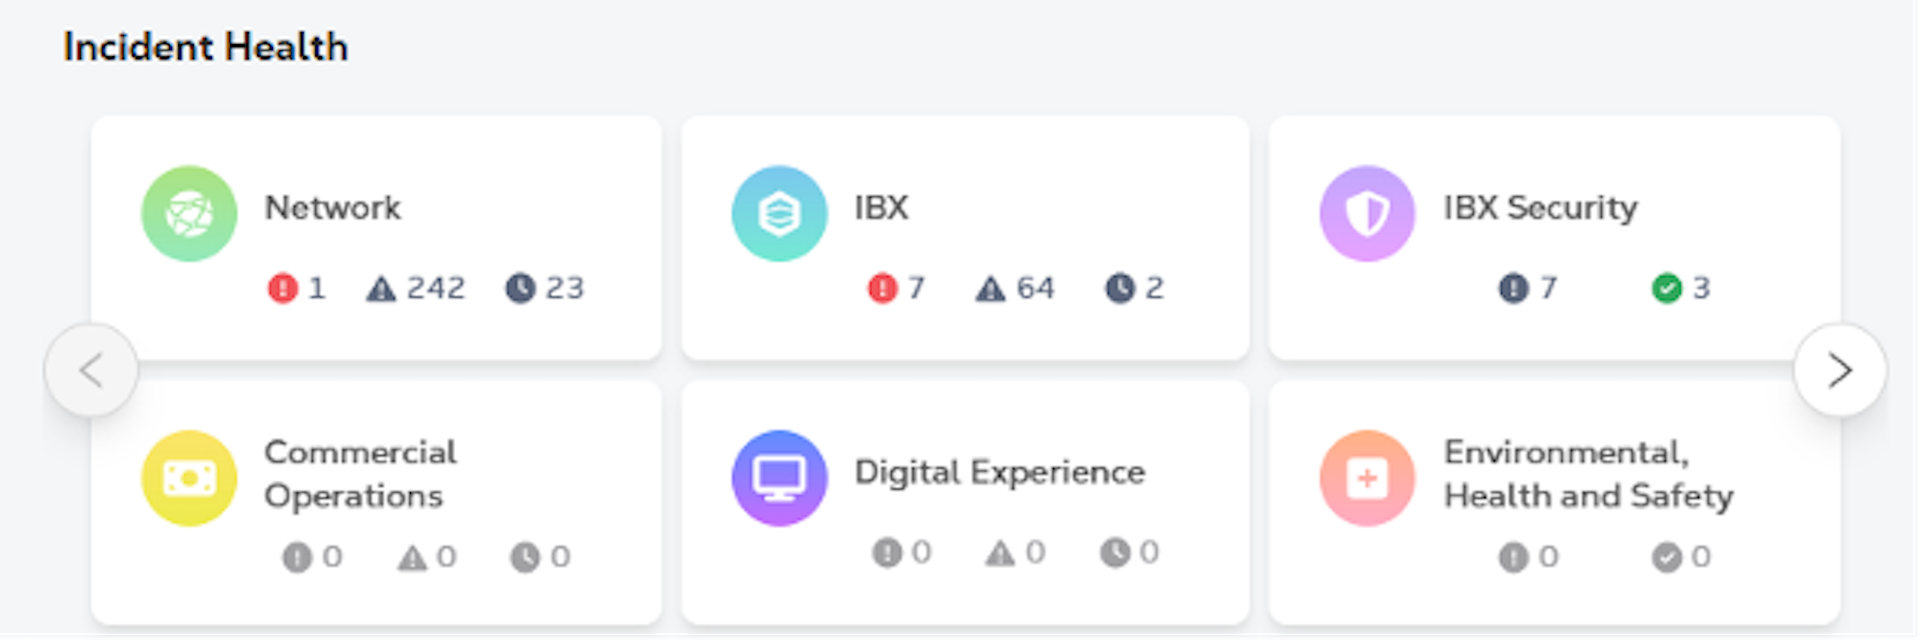
Incident Health
The Incident Health section shows standard incident categories available to all users with access to Service Insight, including but not limited to Digital Experience, Platform Issues, and other service categories. Select the icon for the incident type you want to view.
Select an incident type to open a window that shows a summary of incidents across three tabs: Service Impacting, Non-Service Impacting, and Under Investigation. Each tab lists incidents in descending order by the date and time of the most recent update.
- Click an incident card to view incident details.
Latest Incidents
The Latest Incidents section displays the five most recently updated or added incidents. Hover over an incident to view additional details. Use the filter to show only service-impacting incidents.
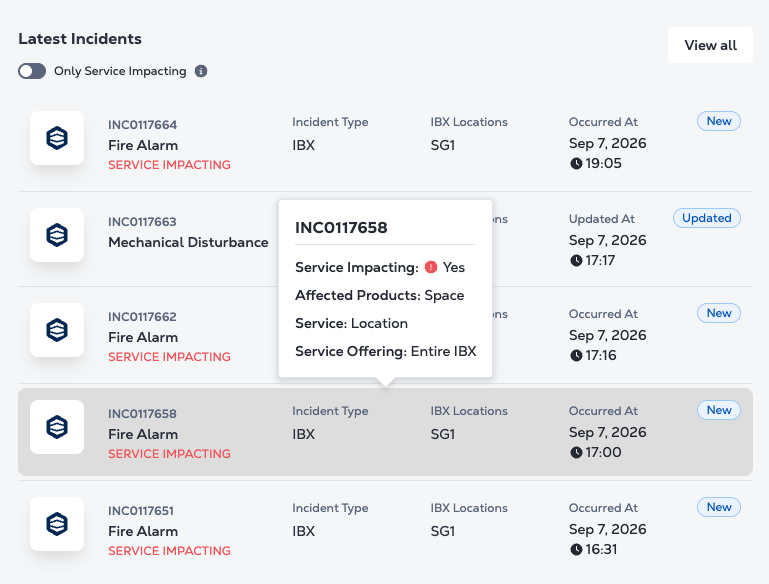
Click an incident in the Latest Incidents section or look under Geographical View to open the Incident Details view.
Support and Feedback
For questions about Service Insight or a specific incident, you can contact your Customer Success Manager (CSM) or the Global Service Desk (GSD), or you can contact Customer Support.
For comments or suggestions about Service Insight, click the Feedback button on the right edge of the Service Insight page, or send email to Product Feedback.
For general questions or comments about our company, products, and services, go to Tell Equinix – We're Listening.