Insights Dashboard
Use the Fabric Insights Hub Dashboard to view Fabric events and alerts across your infrastructure from a single location in Fabric Portal.
The dashboard provides a centralized experience to monitor recent activity, review alert severity distribution, investigate events and alerts, and filter insights across selected projects and organizations.
Before You Begin
To access the Fabric Insights Hub Dashboard, you must have the required permissions for the selected project or organization.
You must be one of the following:
- Project Admin
- Organization Admin
Access to events and alerts is based on the existing Fabric permission model. Users can only view insights for projects and organizations they are authorized to access.
Accessing Fabric Insights Hub Dashboard
- Log in to the Customer Portal.
- Go to the Fabric Dashboard.
- From the Observability menu, select Insights Dashboard.
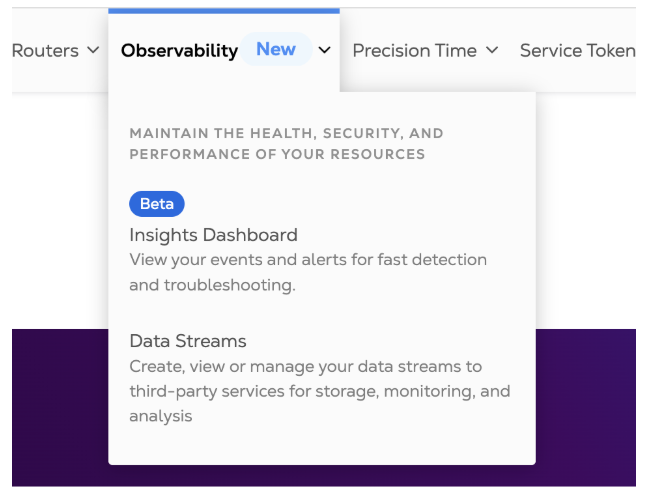
The Insights Dashboard opens with the following three tabs:
- Overview
- Events
- Alerts
Select Projects and Organizations
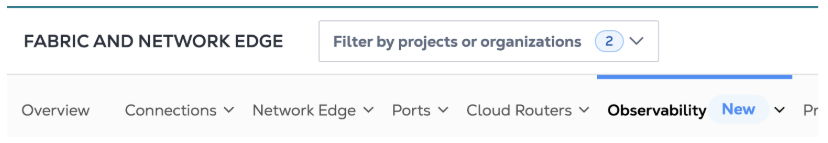
The Fabric Insights Hub Dashboard includes a dedicated project and organization selector. Use this selector to filter the dashboard by one or more projects or organizations.
- Click Filter by projects or organizations.
- In the Select projects dialog box, search for an organization or project name.
- Select one or more organizations or projects.
- Click Apply.
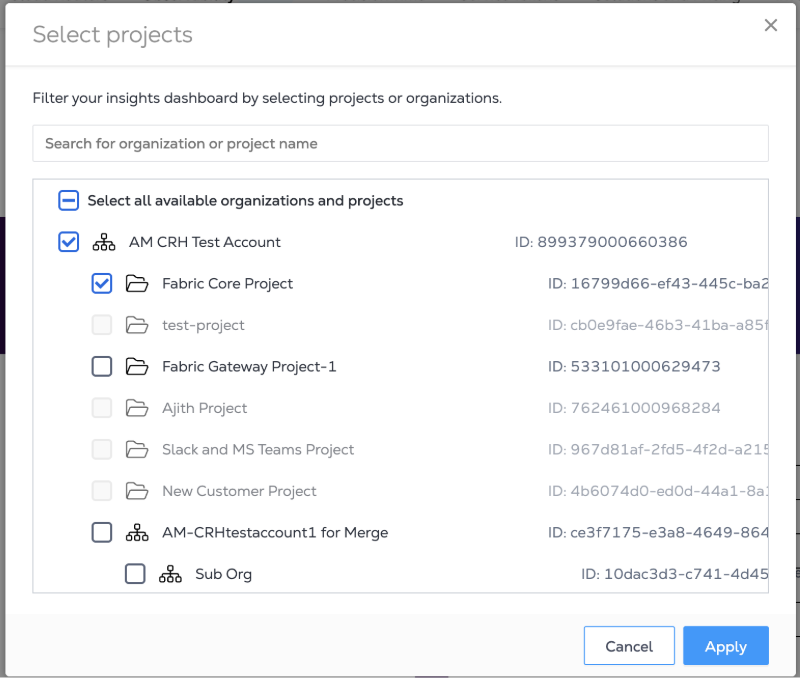
After applying the selection, the dashboard updates to show insights for the selected projects and organizations.
Overview Tab
Use the Overview tab to get a high-level summary of Fabric events and alerts. The Overview tab includes:
- Your Hub
- Recent Alerts
- Recent Events
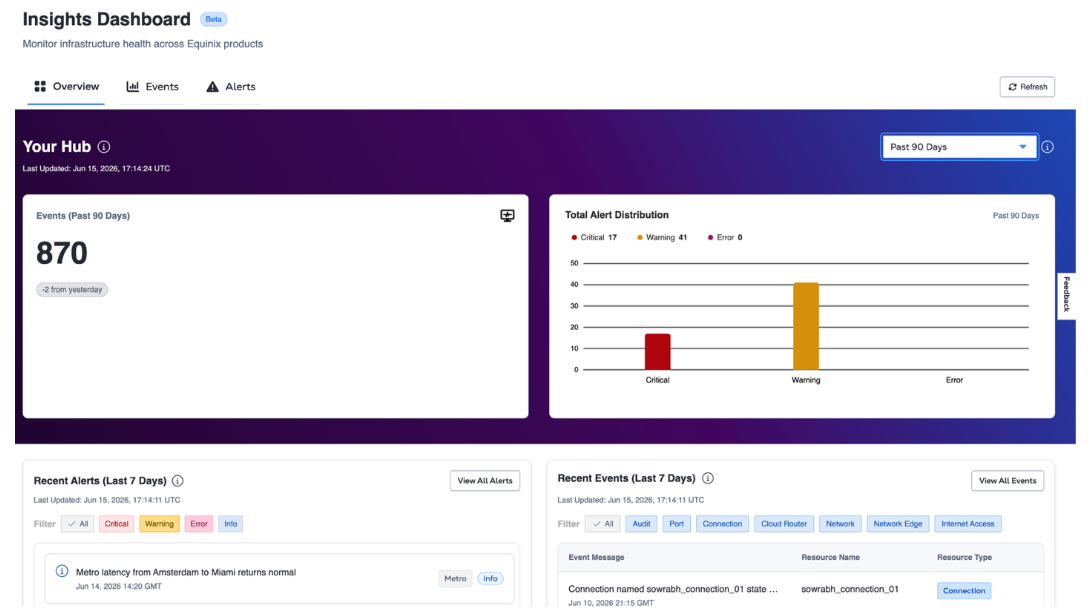
Your Hub
The Your Hub section provides a summary of event and alert activity for the selected time range. It includes:
- Events Card
- Total Alert Distribution chart
- Date Range Selector
Use the Date Range Selector to update the Events Card and Total Alert Distribution chart. The Overview tab supports the following date range options:
- Past 24 Hours
- Past 48 Hours
- Past 72 Hours
- Past 90 Days
- Custom Date
When using Custom Date, users can select data up to the last 90 days.
The Events card shows the total number of events for the selected time range.
The Total Alert Distribution chart shows alert counts by severity, including:
- Critical
- Warning
- Error
This helps users quickly understand overall event volume and alert severity distribution across the selected projects or organizations.
Recent Alerts
The Recent Alerts section provides a preview of the latest alert events. By default, it shows recent alert events from the last 7 days. Users can filter recent alerts by severity:
- All
- Critical
- Warning
- Error
- Info
This section helps users quickly review recent alert activity without opening the full Alerts tab.
Recent Events
The Recent Events section provides a preview of the latest non-alert events. By default, it shows recent events from the last 7 days. Users can filter recent events by event or resource type, including:
- All
- Audit
- Port
- Connection
- Cloud Router
- Network
- Network Edge
- Internet Access
The Audit filter includes audit-related activity such as login and logout events.
This section helps users quickly review recent Fabric activity across different resource types.
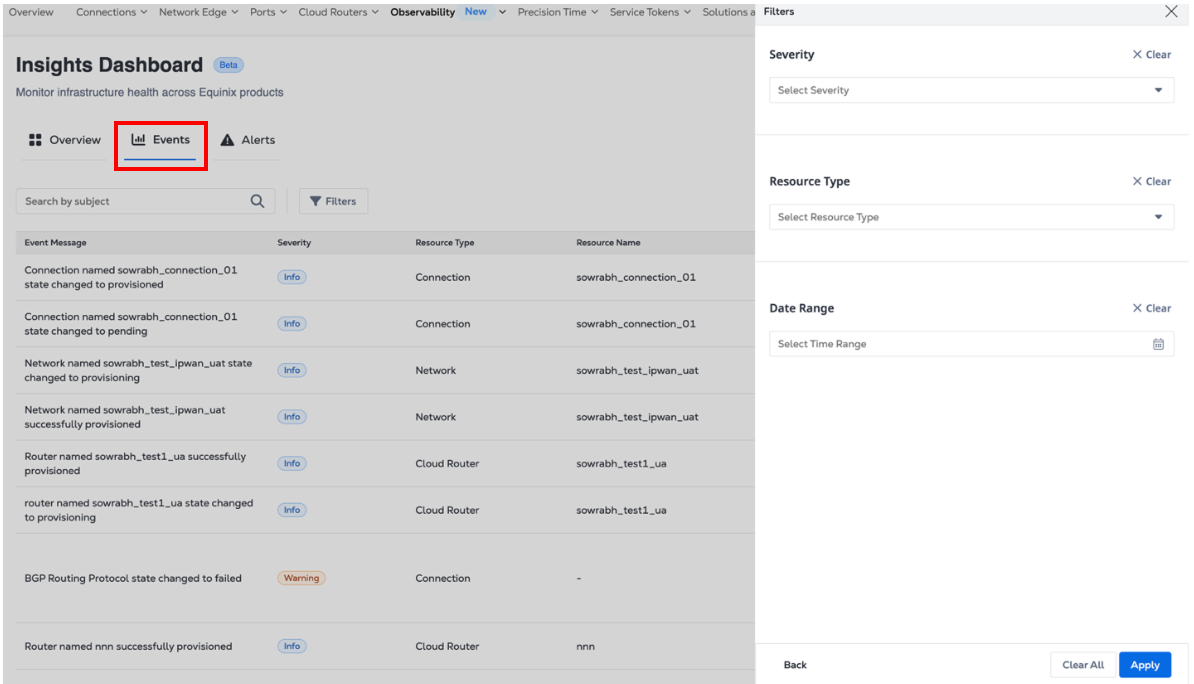
Events Tab
Use the Events tab for deeper event investigation. By default, the Events tab shows event data from the last 7 days. Users can use the Date Range filter to select a custom date range up to the last 90 days. The Events tab provides a searchable and filterable table of Fabric events. Users can search events by subject and apply filters to narrow down results.
For example, to search for events related to a specific Fabric port, enter a subject path in the following format: /fabric/v4/ports/{portId}
Example: /fabric/v4/ports/f14420a5-45e9-4b4f-b3c9-034609c7a191
In this example, f14420a5-45e9-4b4f-b3c9-034609c7a191 represents a sample Fabric port ID.
Supported filters include:
- Severity: Multi-select support for Critical, Error, Info, and Warning.
- Resource Type: Audit, Cloud Router, Connection, Internet Access, Network, Network Edge, Port, Precision Time, and Service Token.
- Date Range
The Events table includes event details such as:
- Event Message
- Severity
- Resource Type
- Resource Name
- Subject
- Date and Time
Use the Events tab when you need to investigate event activity in more detail across selected projects and organizations.
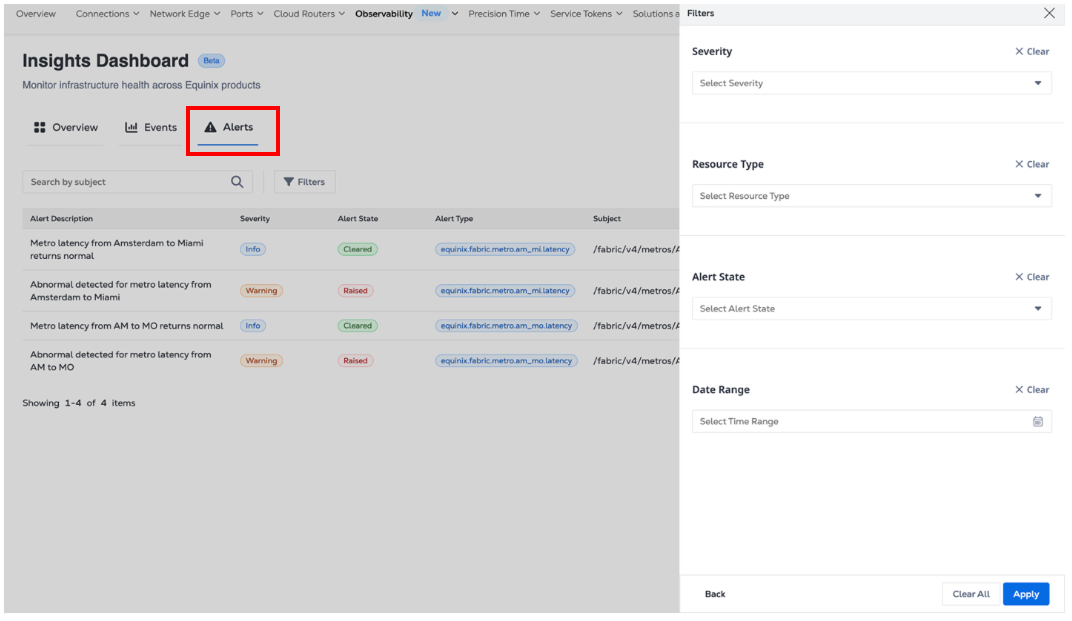
Alerts Tab
Use the Alerts tab for deeper alert investigation. By default, the Alerts tab shows alert data from the last 7 days. Users can use the Date Range filter to select a custom date range up to the last 90 days. The Alerts tab provides a searchable and filterable table of Fabric alerts. Users can search alerts by subject and apply filters to narrow down results.
For example, to search for alerts related to a specific Fabric port, enter a subject path in the following format: /fabric/v4/ports/{portId}
Example: /fabric/v4/ports/f14420a5-45e9-4b4f-b3c9-034609c7a191
In this example, f14420a5-45e9-4b4f-b3c9-034609c7a191 represents a sample Fabric port ID.
Supported filters include:
- Severity: Multi-select support for Critical, Error, Info, and Warning.
- Resource Type: Cloud Router, Connection, Internet Access, Metro, Network, Network Edge, Port, Precision Time, and Service Token.
- Alert State: Multi-select support for Cleared and Raised.
- Date Range
The Alerts table includes alert details such as:
- Alert Description
- Severity
- Alert State
- Alert Type
- Subject
- Resource Type
- Date and Time
Use the Alerts tab when you need to review alert history, alert state, and severity across selected projects and organizations.
Refreshing Dashboard Data
A Refresh button is available on each tab. Click Refresh to reload the latest available data for the active tab. Each tab displays a Last Updated timestamp to show when the data was last refreshed.