Monitoring Port Utilization
Port utilization statistics provide insight into the traffic volume and quality that goes through your ports. Use this information to monitor your ports usage, provision new higher capacity ports and migrate your connections to ensure sufficient bandwidth available for your services.
To view a port's utilization statistics:
-
Sign in to the Customer Portal. From the global navigation menu, click Fabric.
-
From the Ports menu, select Port Inventory.
-
Locate and click the desired port to view its details.
Metrics
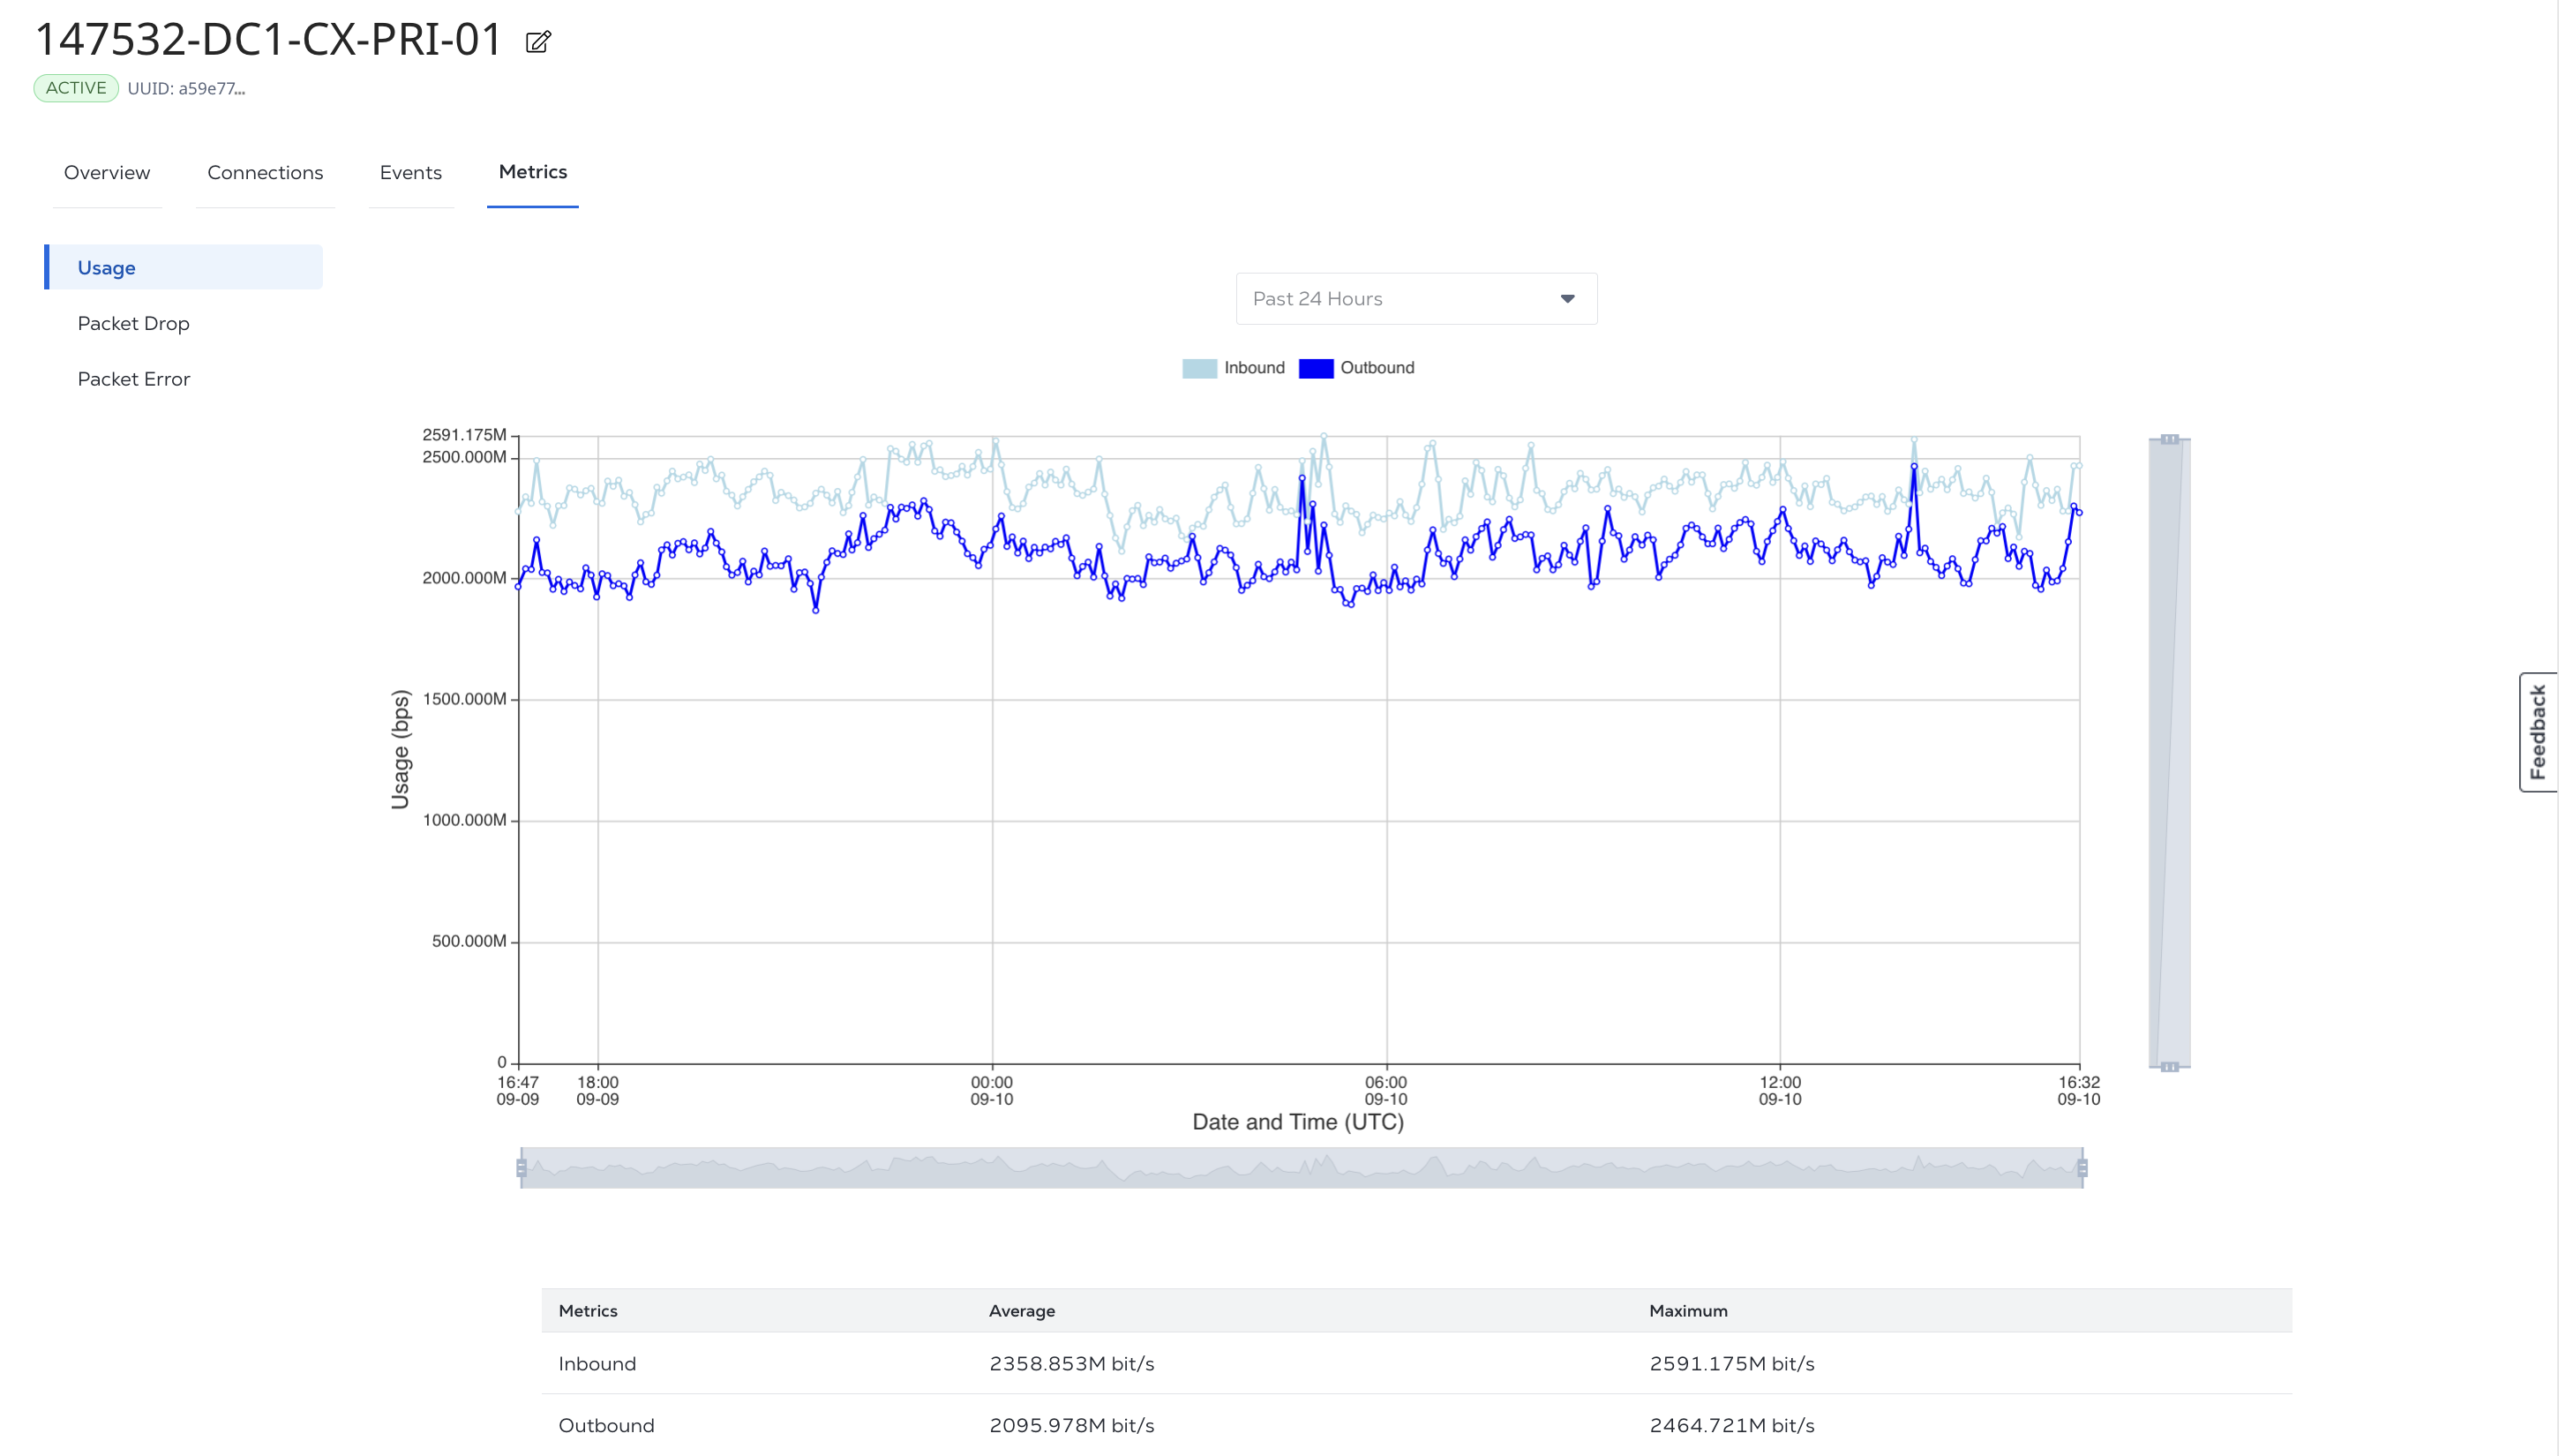
The Metrics tab shows bandwidth, dropped packet, and packet error data for the port.
The Usage graph shows inbound and outbound bandwidth.
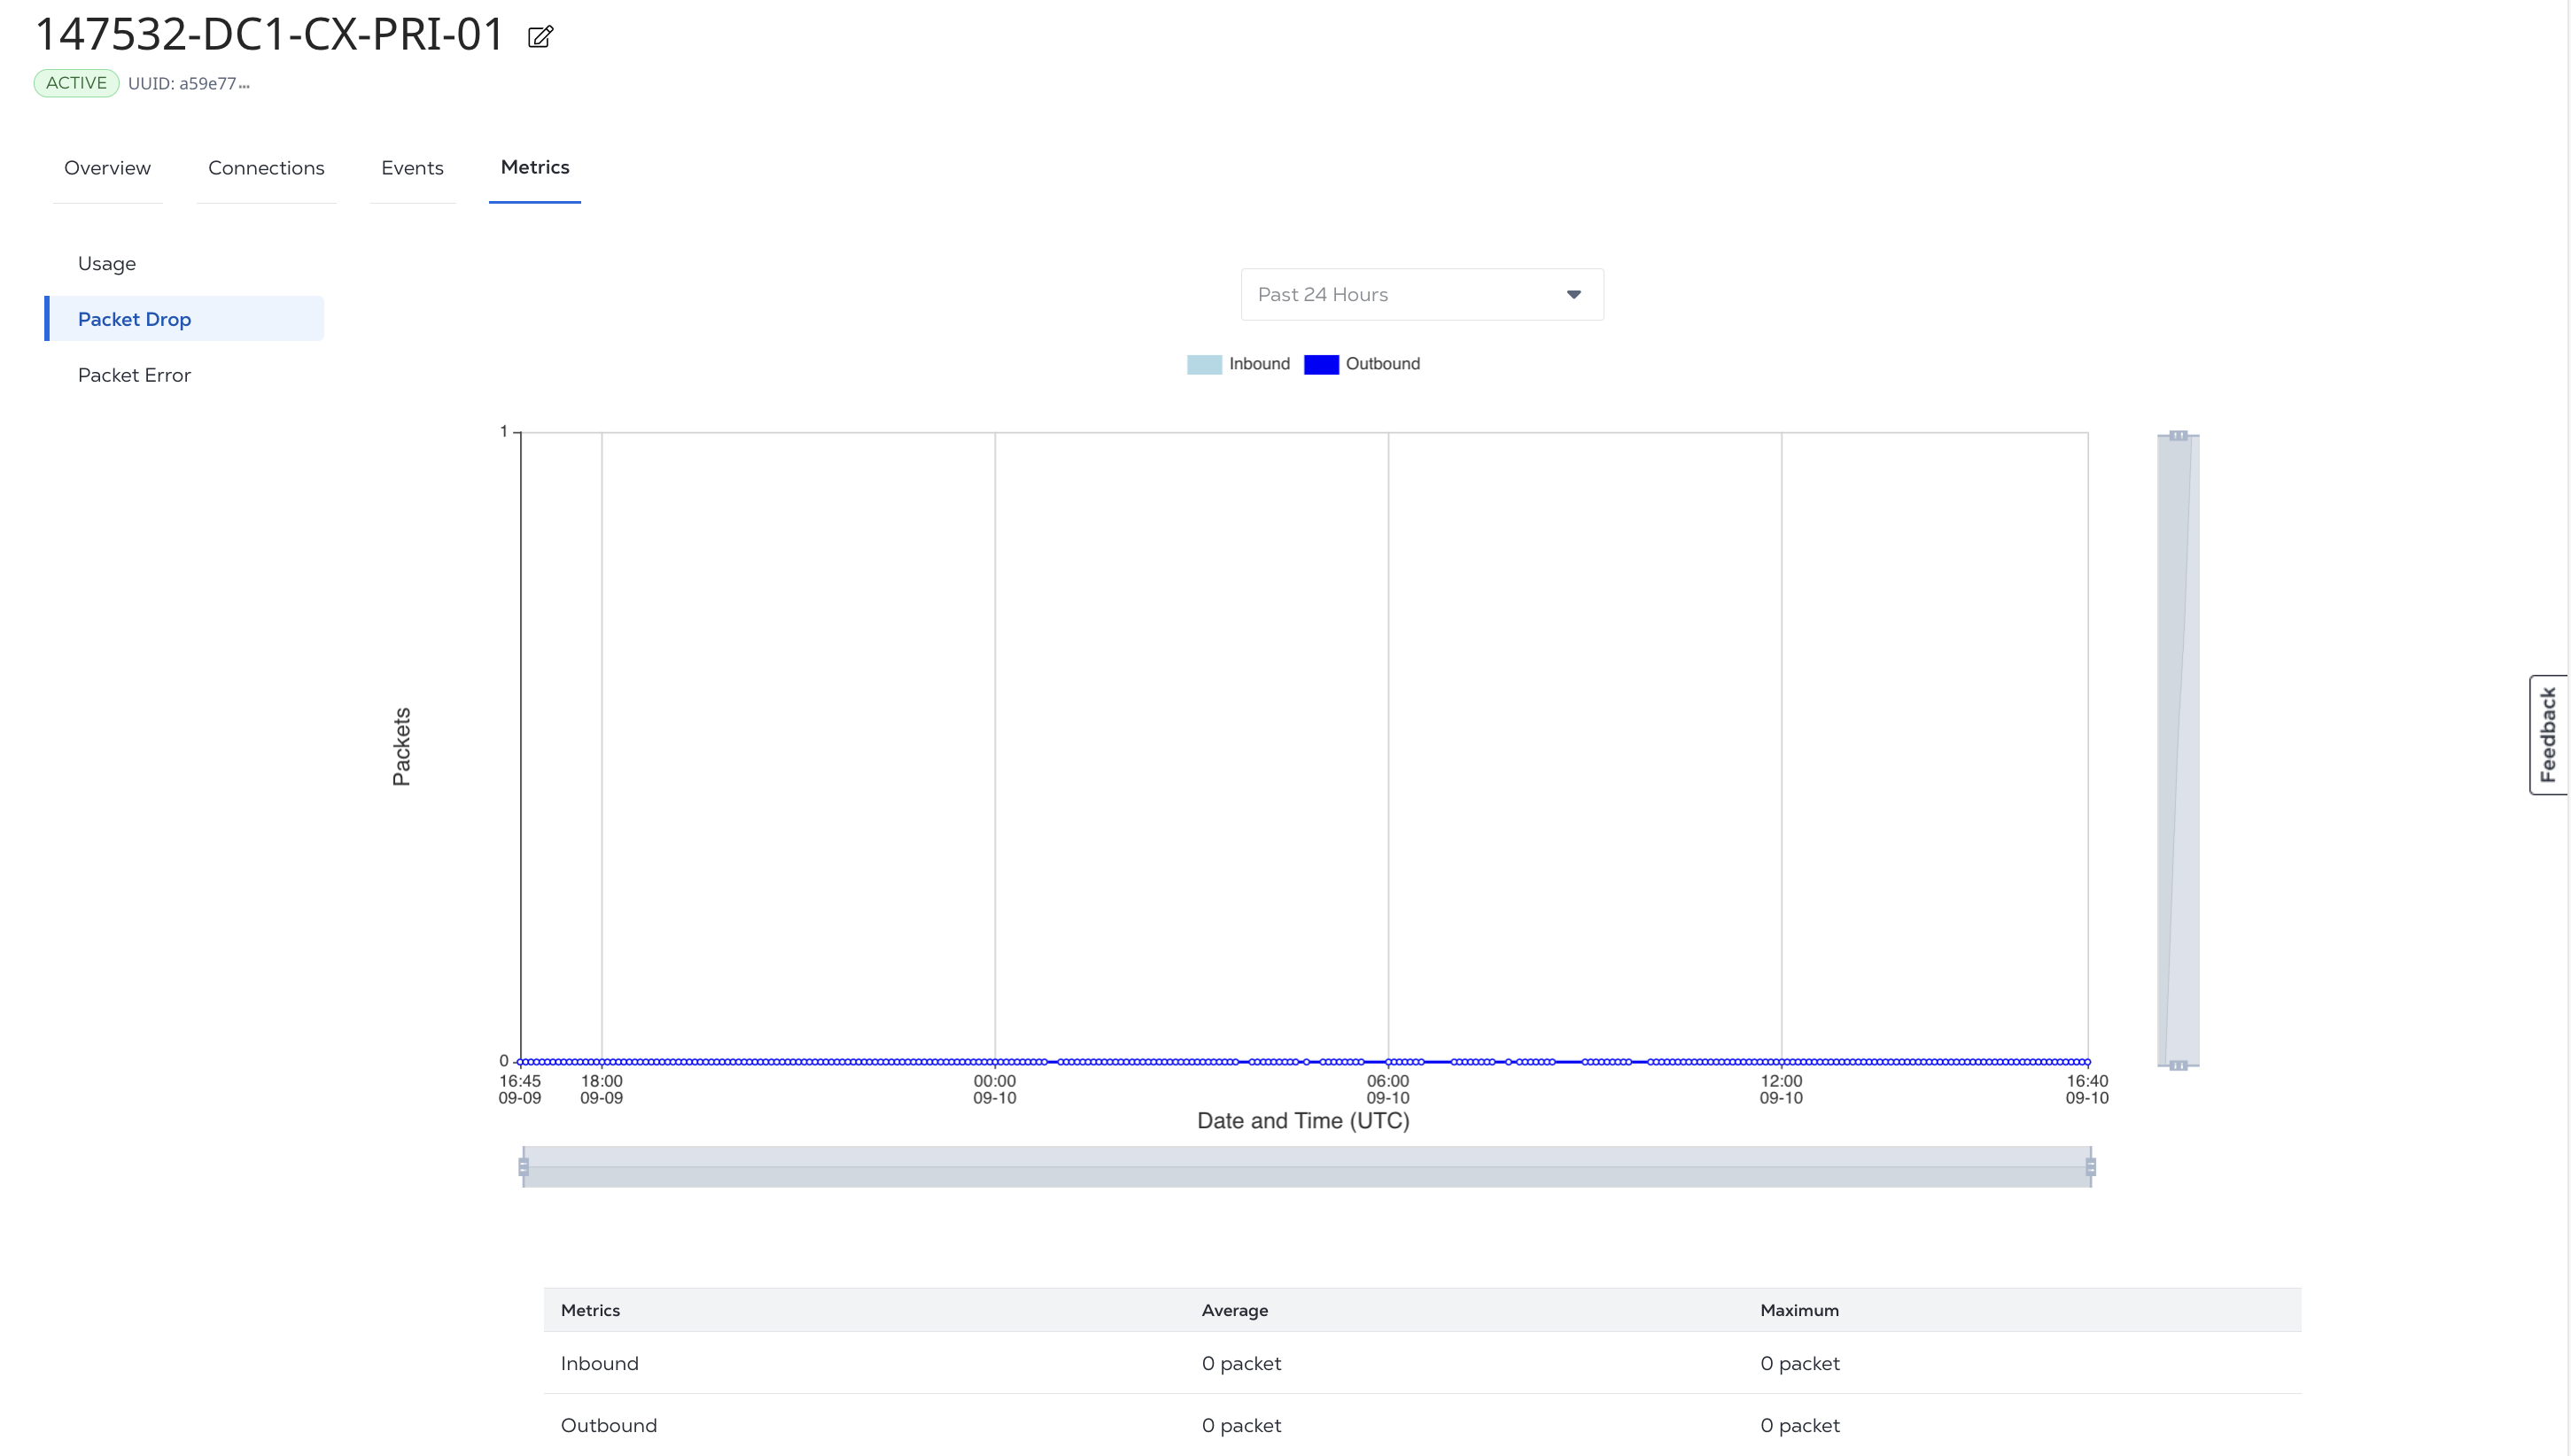
The Packet Drop graph shows the inbound and outbound packets dropped on the port.
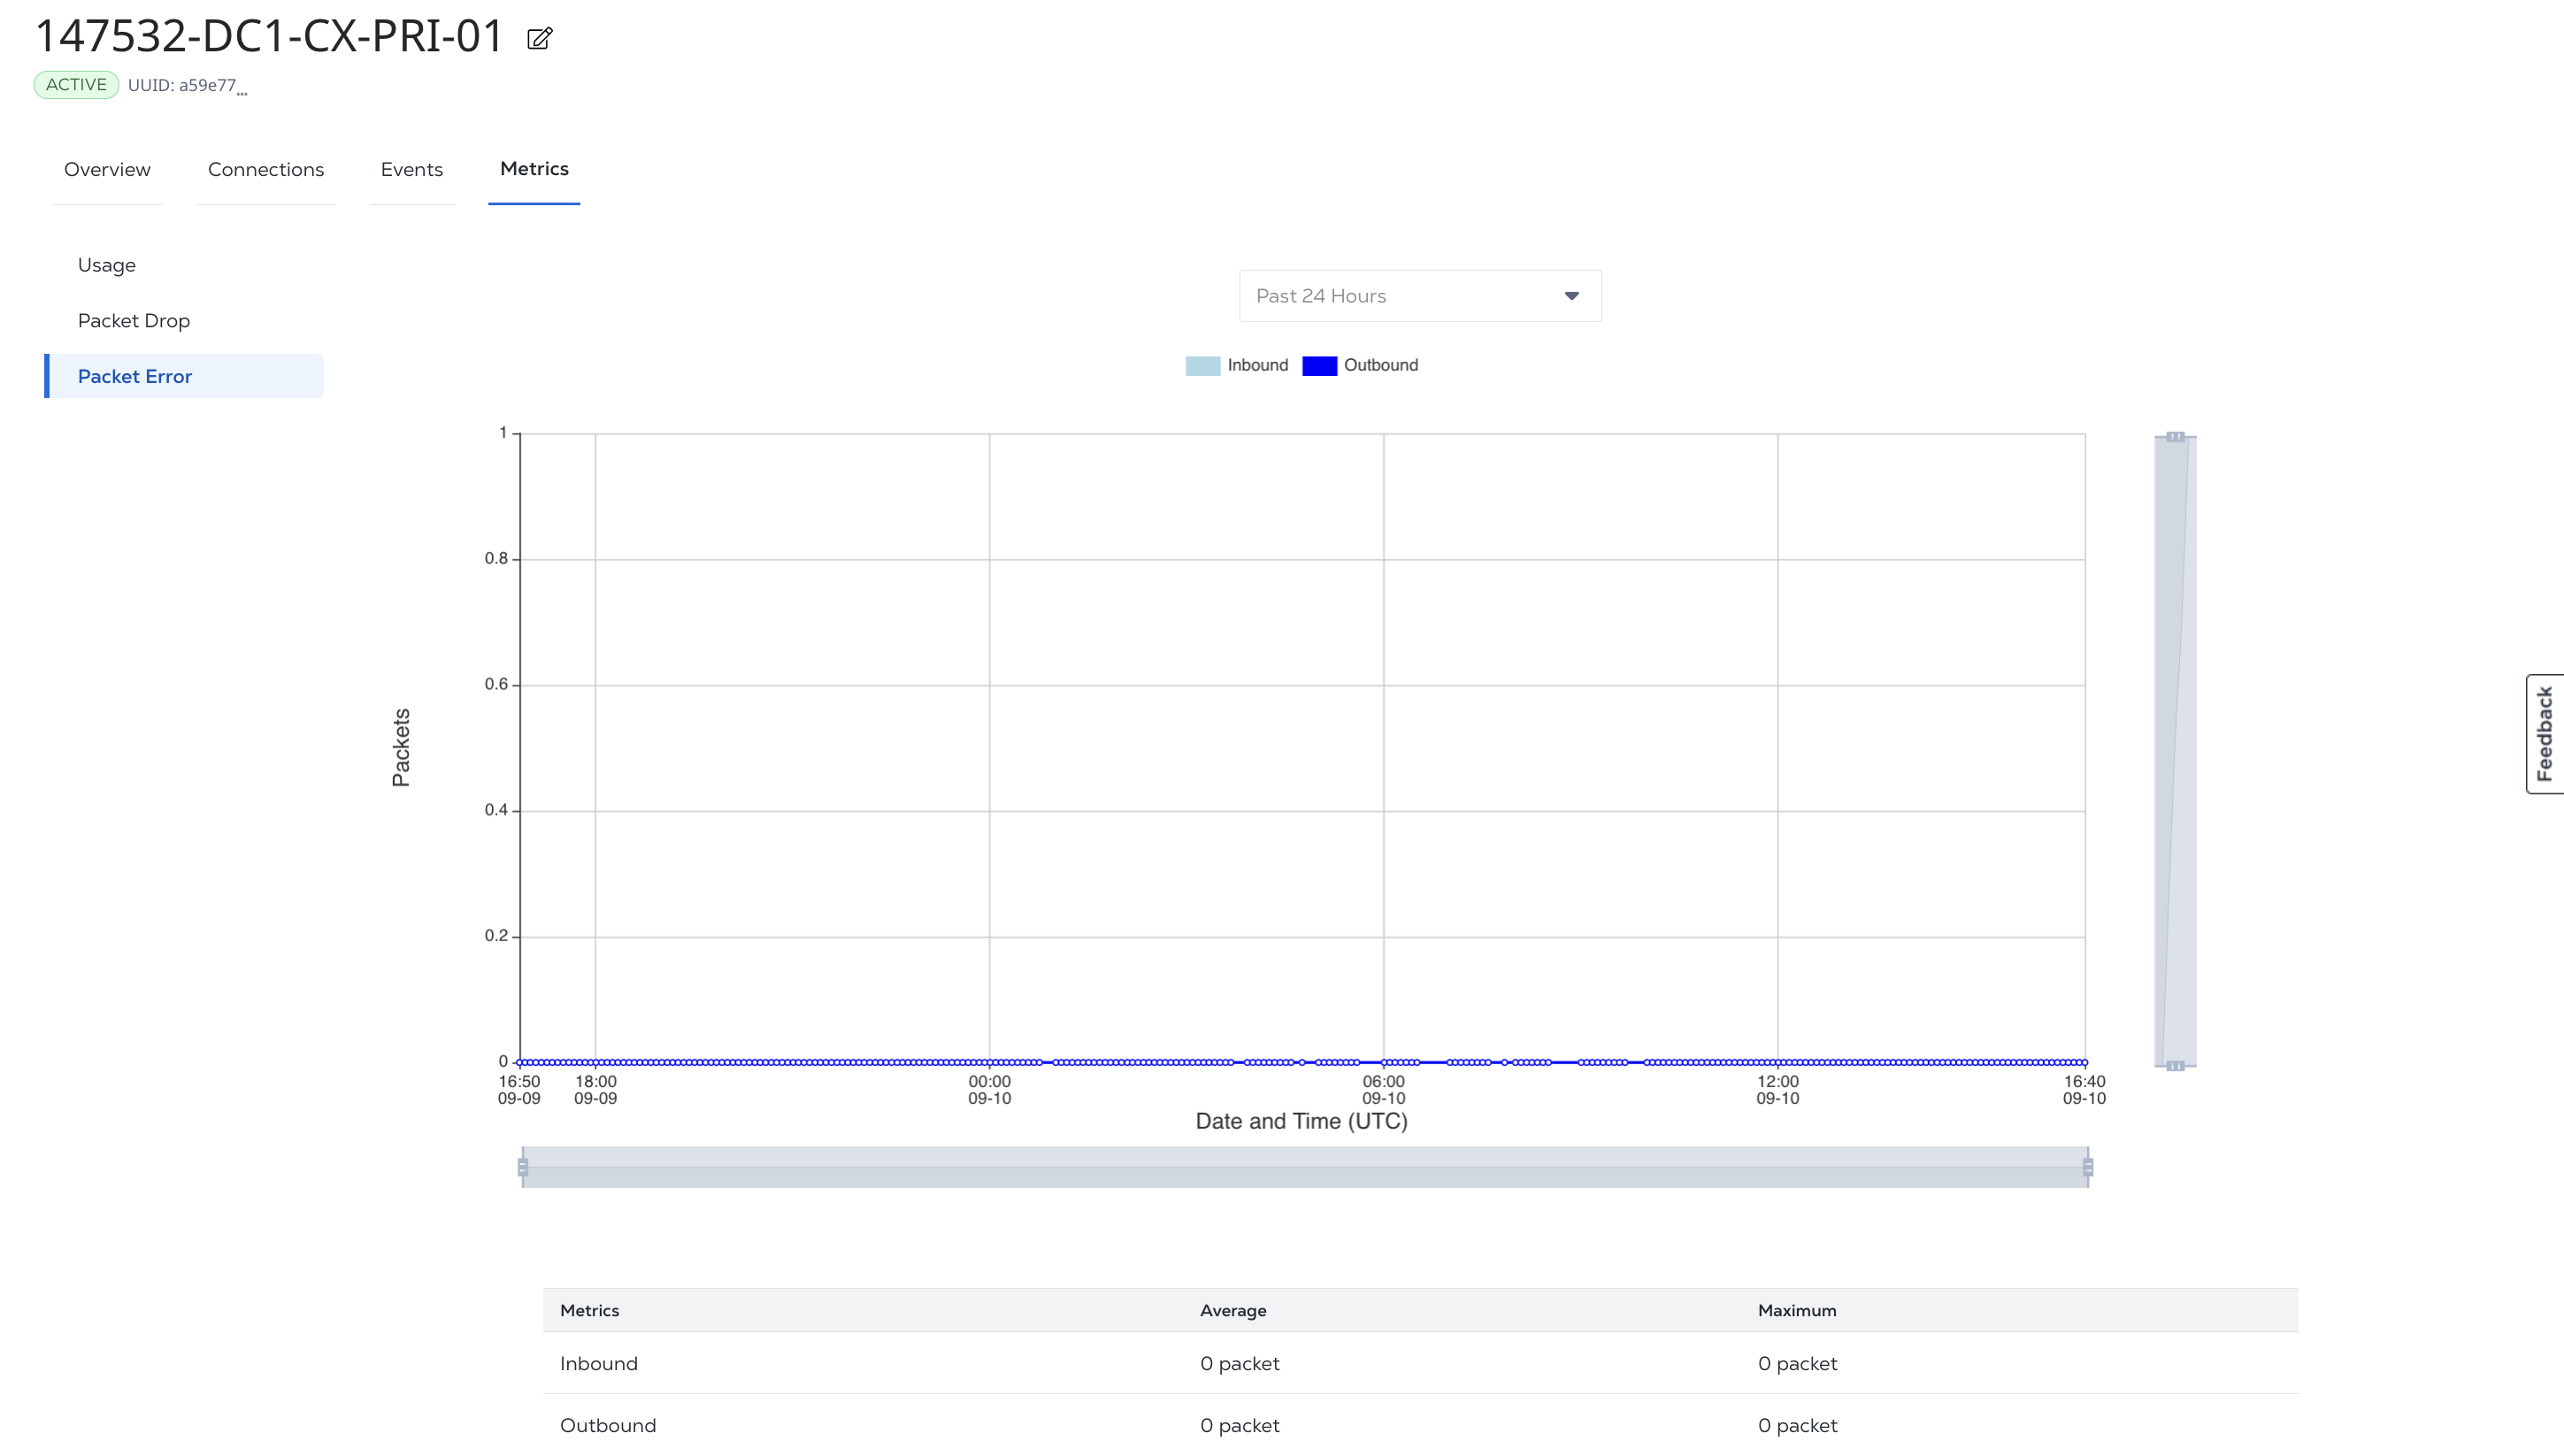
The Packet Error graph shows the inbound and outbound packet errors for the port.
From the Time Period drop-down list, select a predefined setting or choose Custom Date Range to define your own time interval.
Use the sliders at the bottom and to the right of a graph to change the scale. Hover over a the graph to see data for a specific timestamp.
Metric Alert Rules
For instructions on configuring port bandwidth threshold alerts, refer to Managing Metric Alert Rules.
Events
The Events tab shows port lifecycle events for any status change to your asset, including provisioning, deprovisioning, and failures.
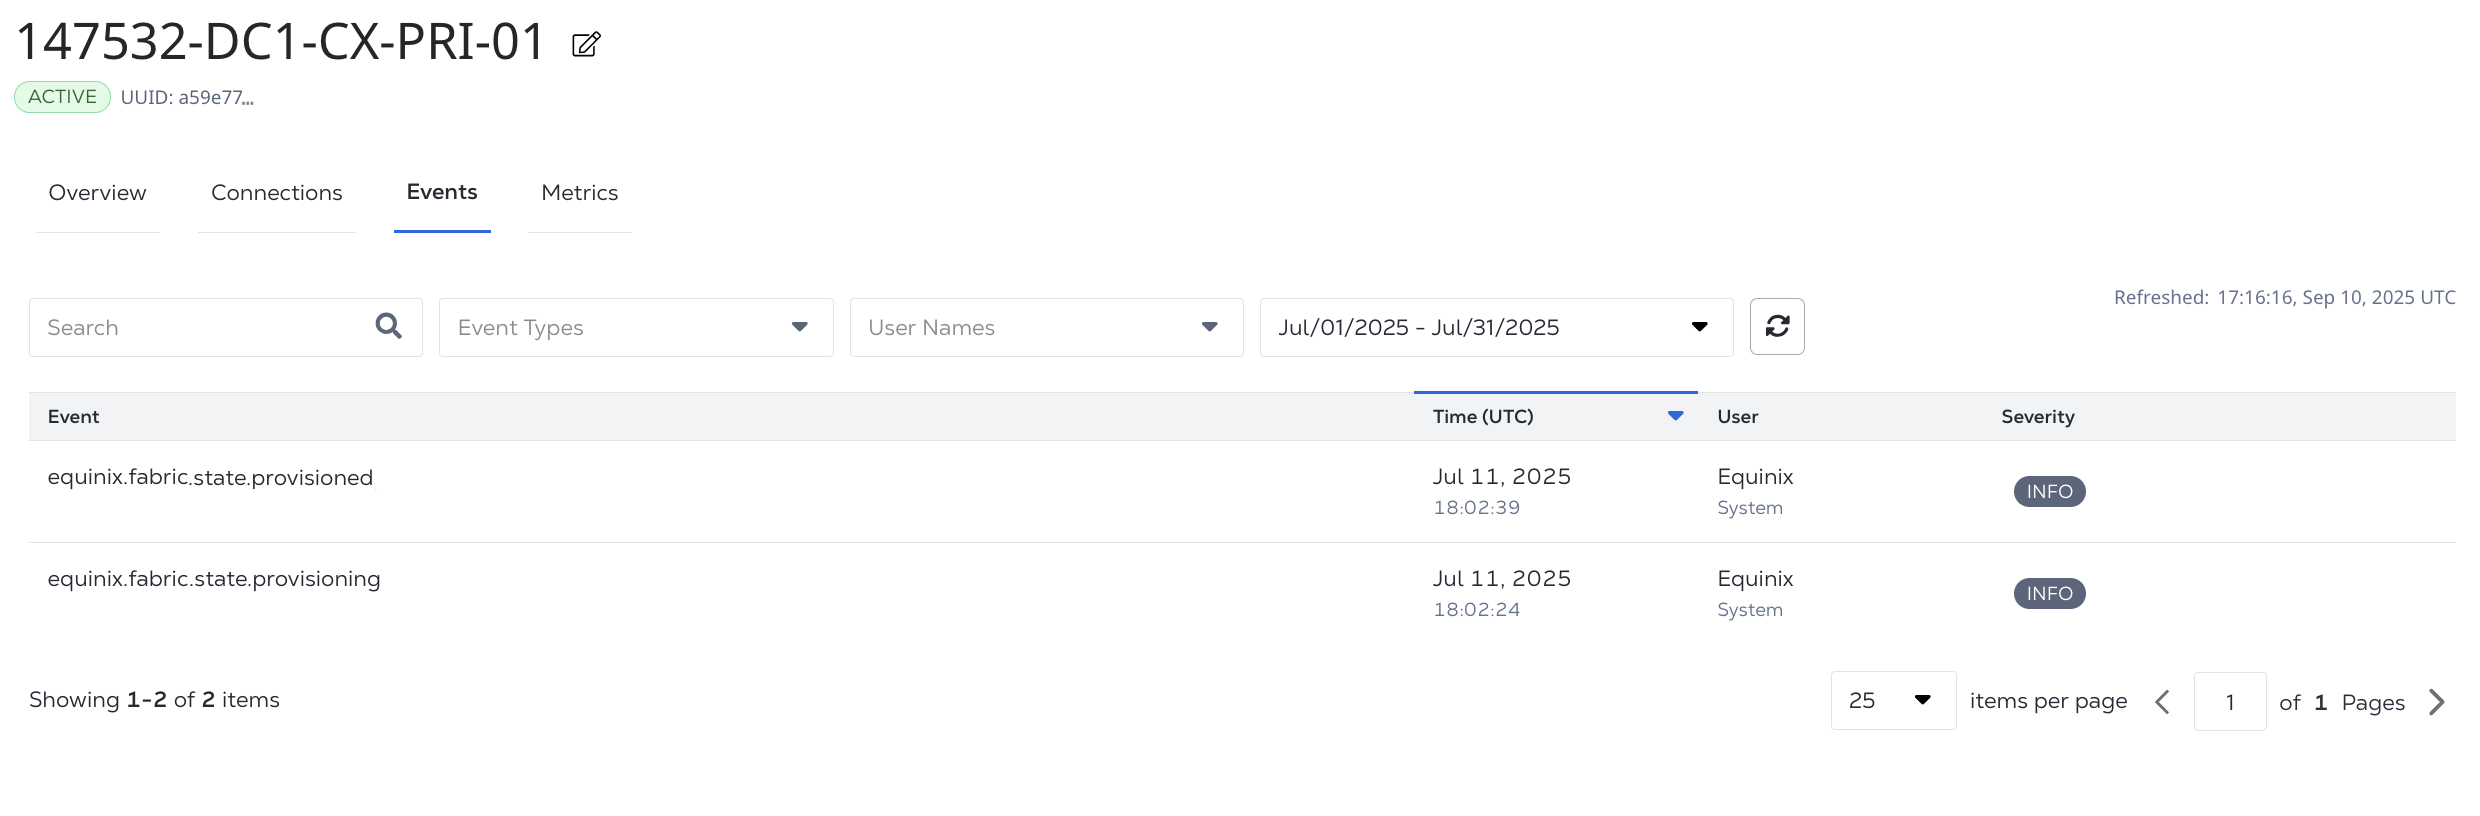
Filter the table by event type, user name. From the Time Period drop-down list, select a predefined setting or choose Custom Date Range to define your own time interval. Events are not refreshed automatically. Click refresh to update the data in the table.
Port Monitoring in the API
The Equinix API offers the ability to create and customize a stream that collects usage data for your ports. Once you have created a stream you can view the data from the Equinix API or create a subscription to have the data sent to your data collection platform.
To configure port monitoring from the API:
To get your data, either:
- Retrieve the data from the Metrics API endpoint or the Events API endpoint
- Create a subscription and send the data to a data collector.