Your Port Inventory
The Port Inventory provides a single location for viewing all of your ports and accessing details for each port.
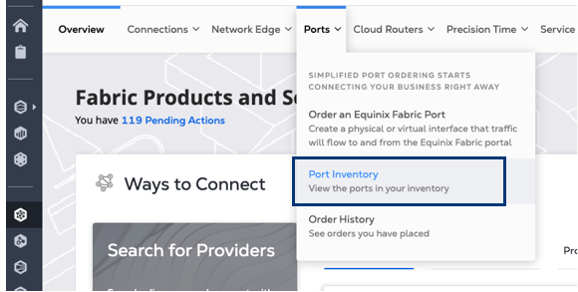
To access the Port Inventory:
-
Sign in to the Customer Portal and navigate to the Fabric Dashboard.
-
From the Ports menu, select Port Inventory.
-
Use the context switcher and select a project to display ports associated with the selected project, or choose an organization to display ports associated with projects nested under the selected organization.
Port Inventory Table
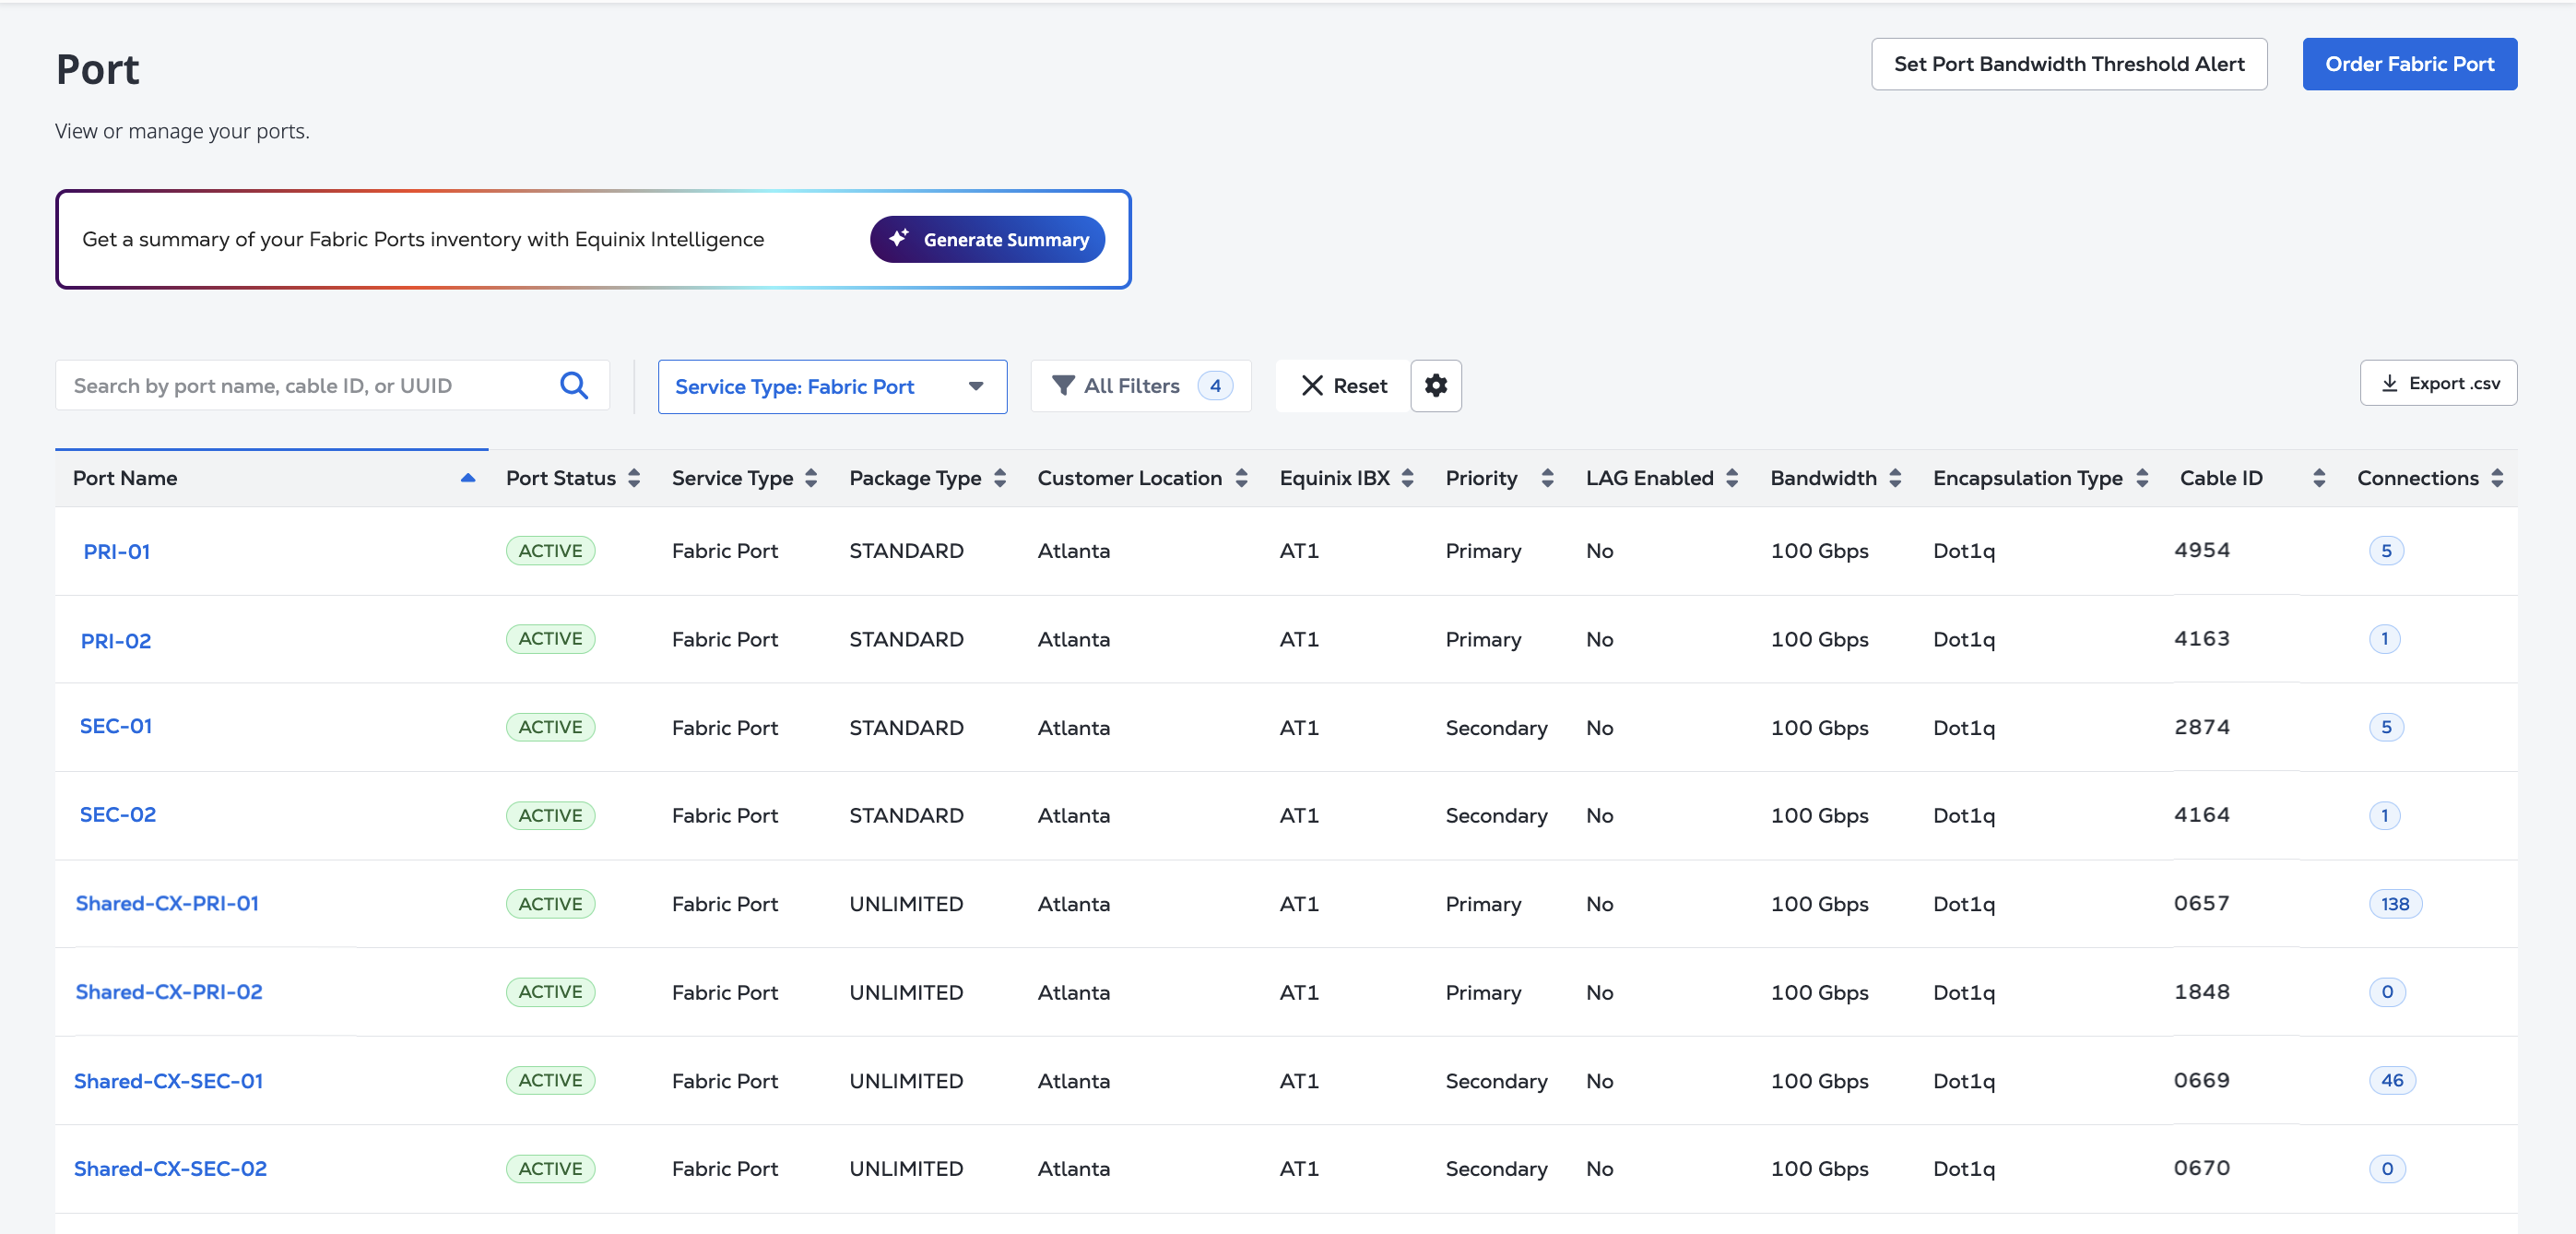
The Port Inventory table provides the following port information:
- Port Name
- Port Status
- Package Type
- Customer Location
- Equinix IBX
- Port Priority
- LAG Indicator
- Bandwidth
- Encapsulation Type
- Cable ID
- Connections Count
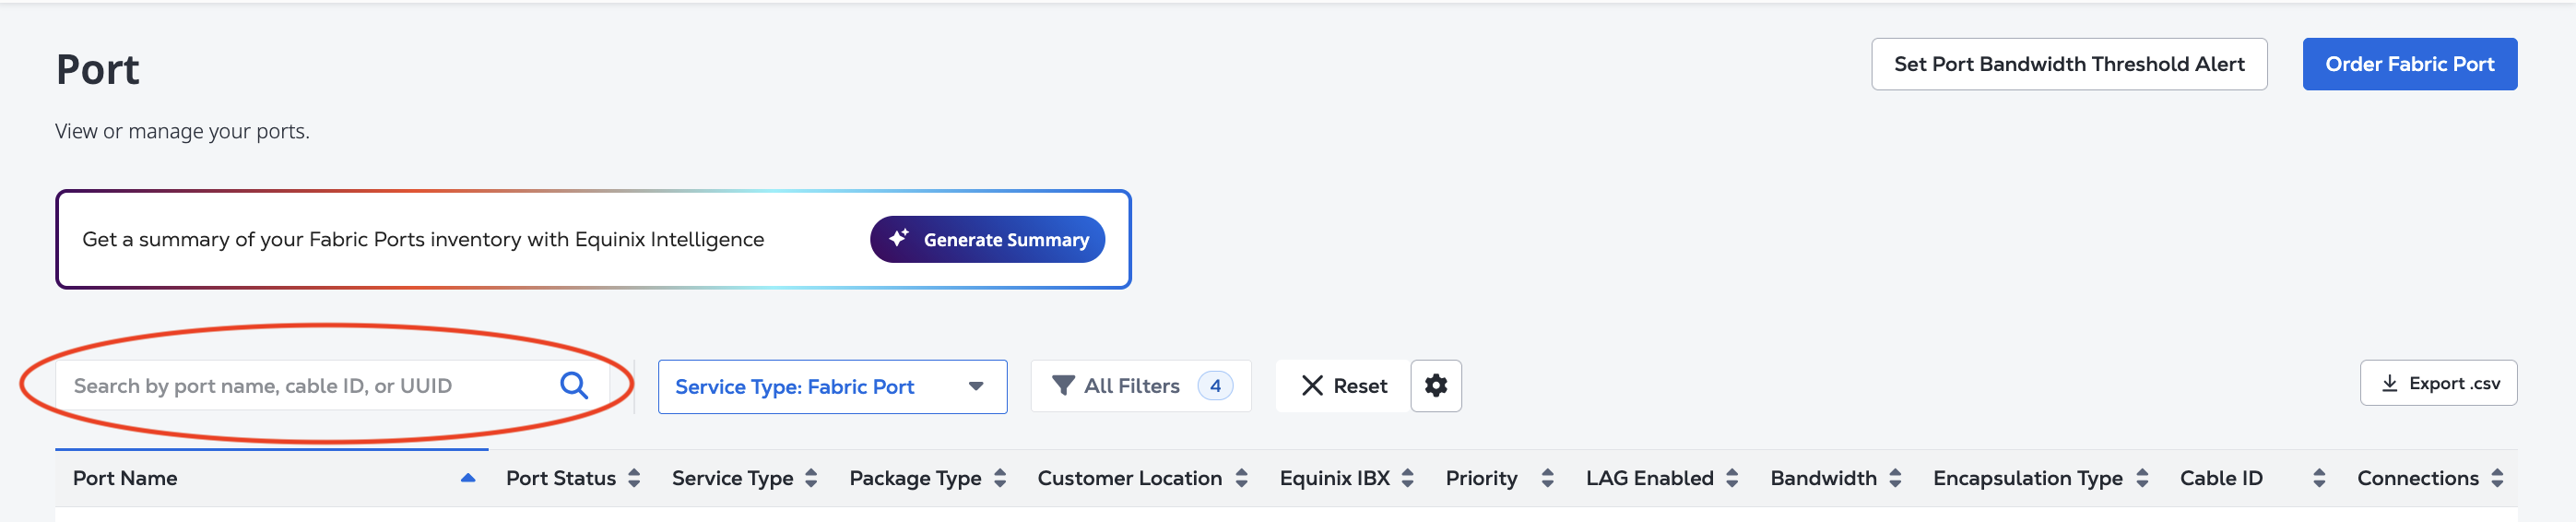
Search
Use the search field to narrow your port list. You can search by Port Name, Cable ID, or UUID.
Filters
Filters are available in the All Filters drawer for Port Status, Location, Bandwidth, Port Priority, LAG Enabled, and Encapsulation.
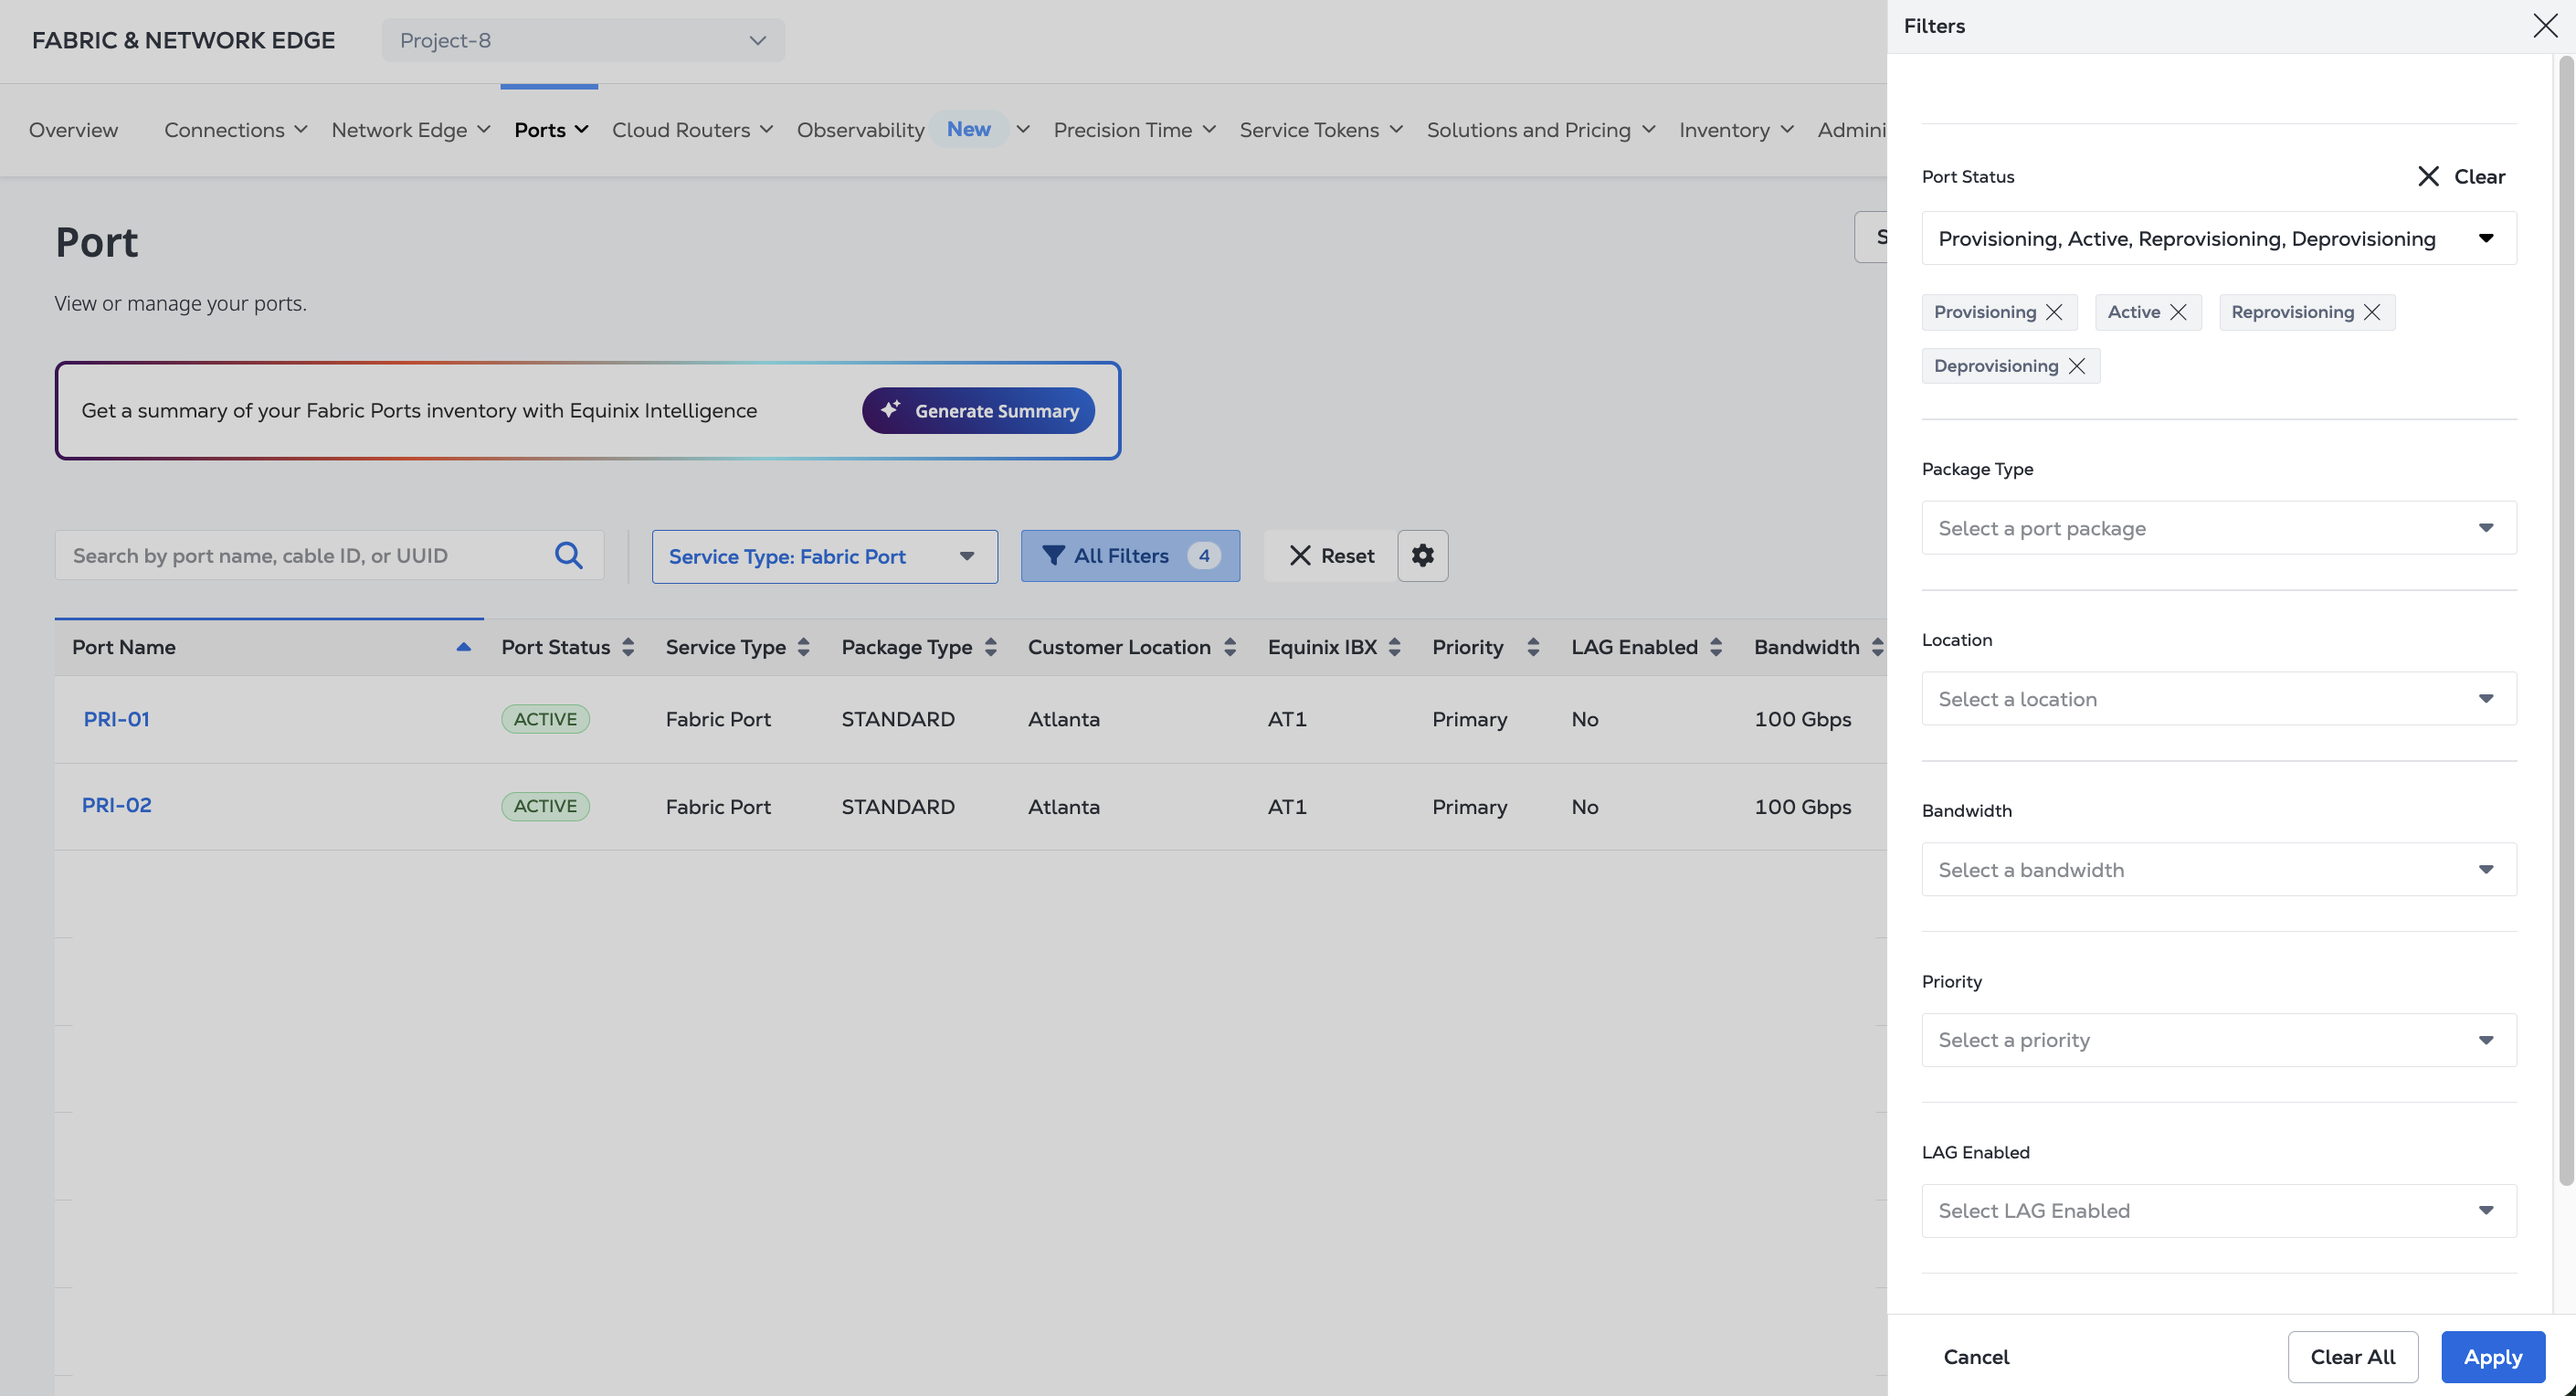
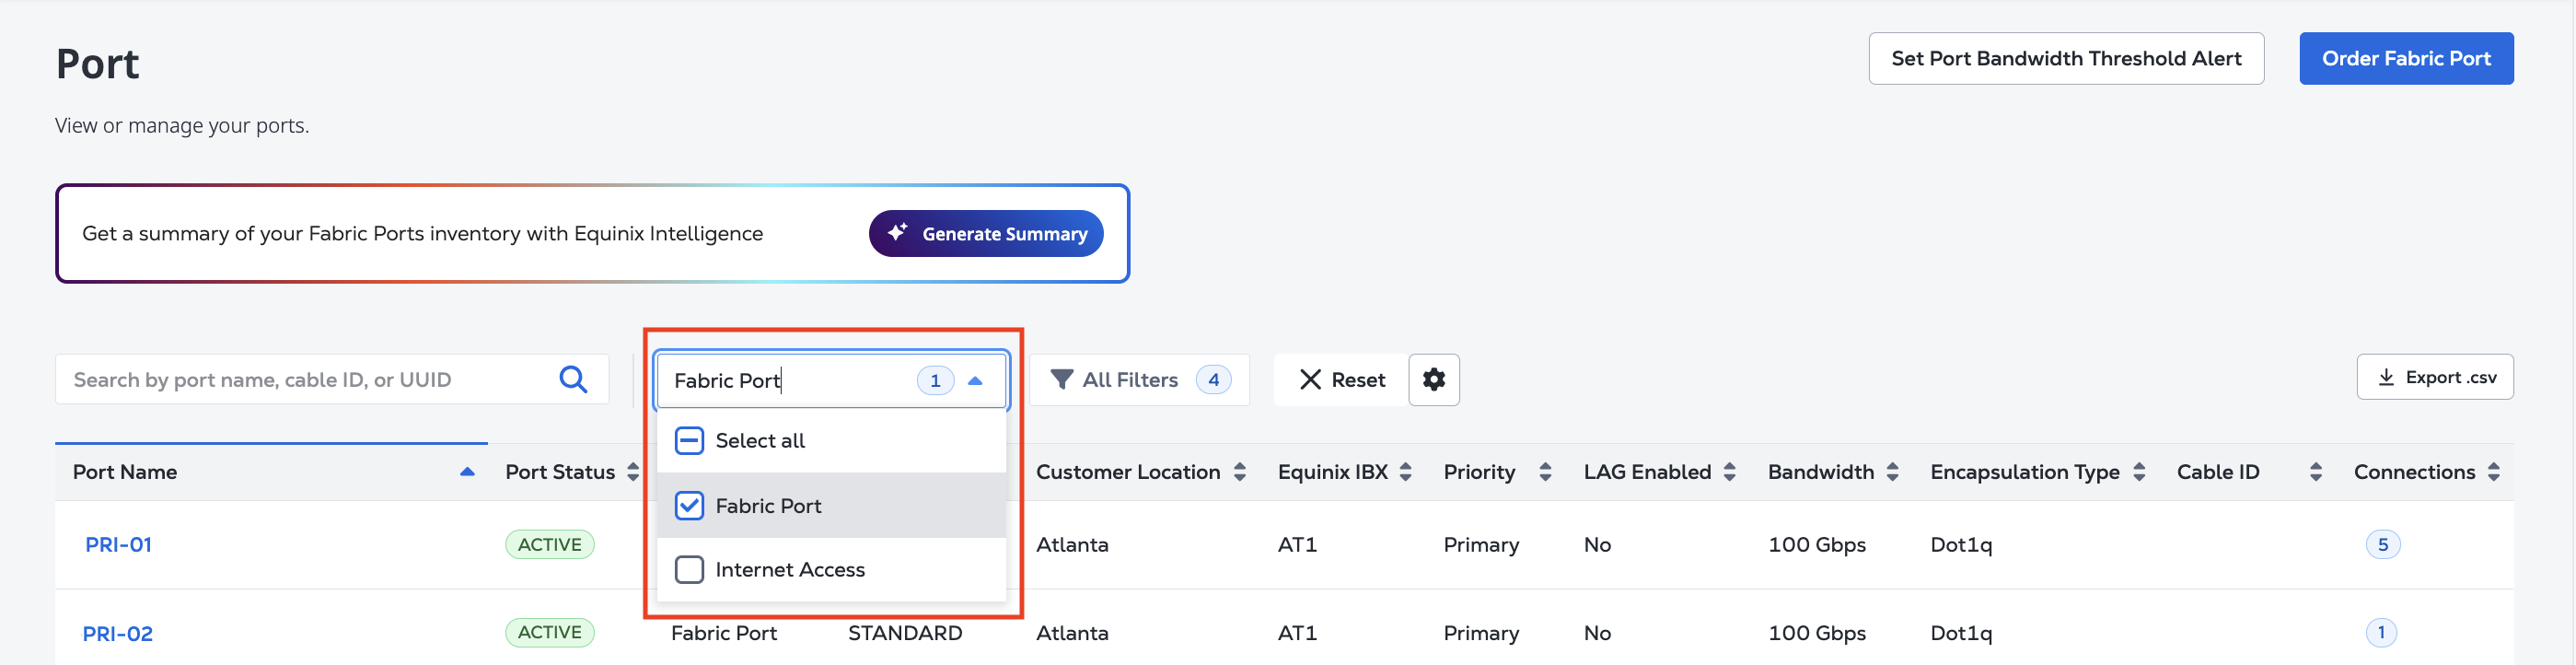
The Service Type filter on the Ports Inventory page allows you to view Fabric ports or Dedicated Equinix Internet Access (EIA) ports.
Column Customization
Customize the columns displayed in the Ports Inventory table to focus on the information most relevant to you.
The Name and Status columns are always pinned and cannot be hidden. All other columns can be shown, hidden, or reordered as needed.
To customize columns:
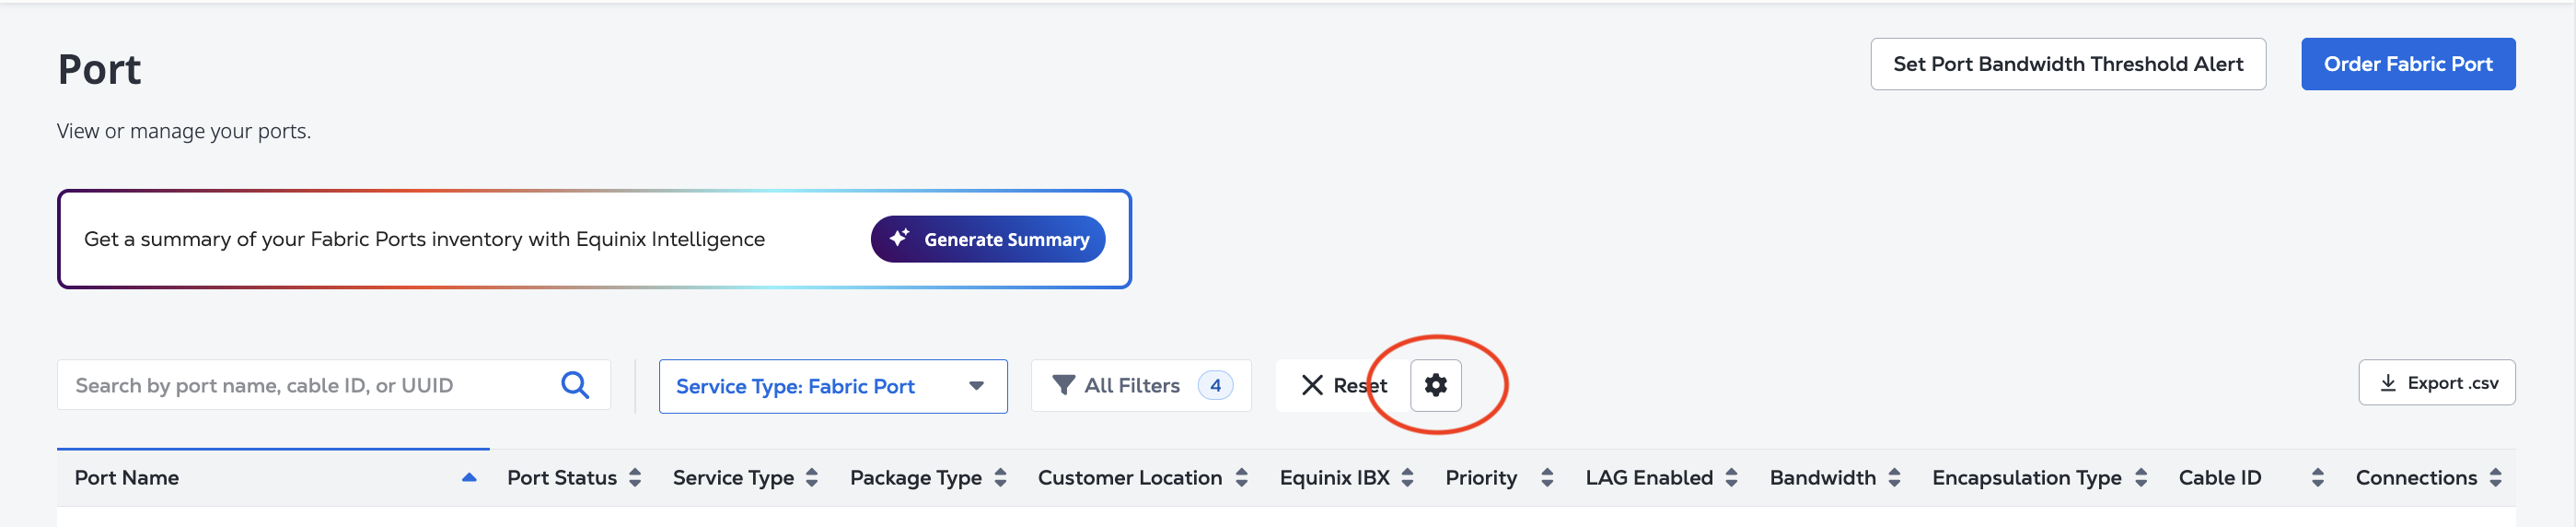
-
On the Ports Inventory page, click Settings.
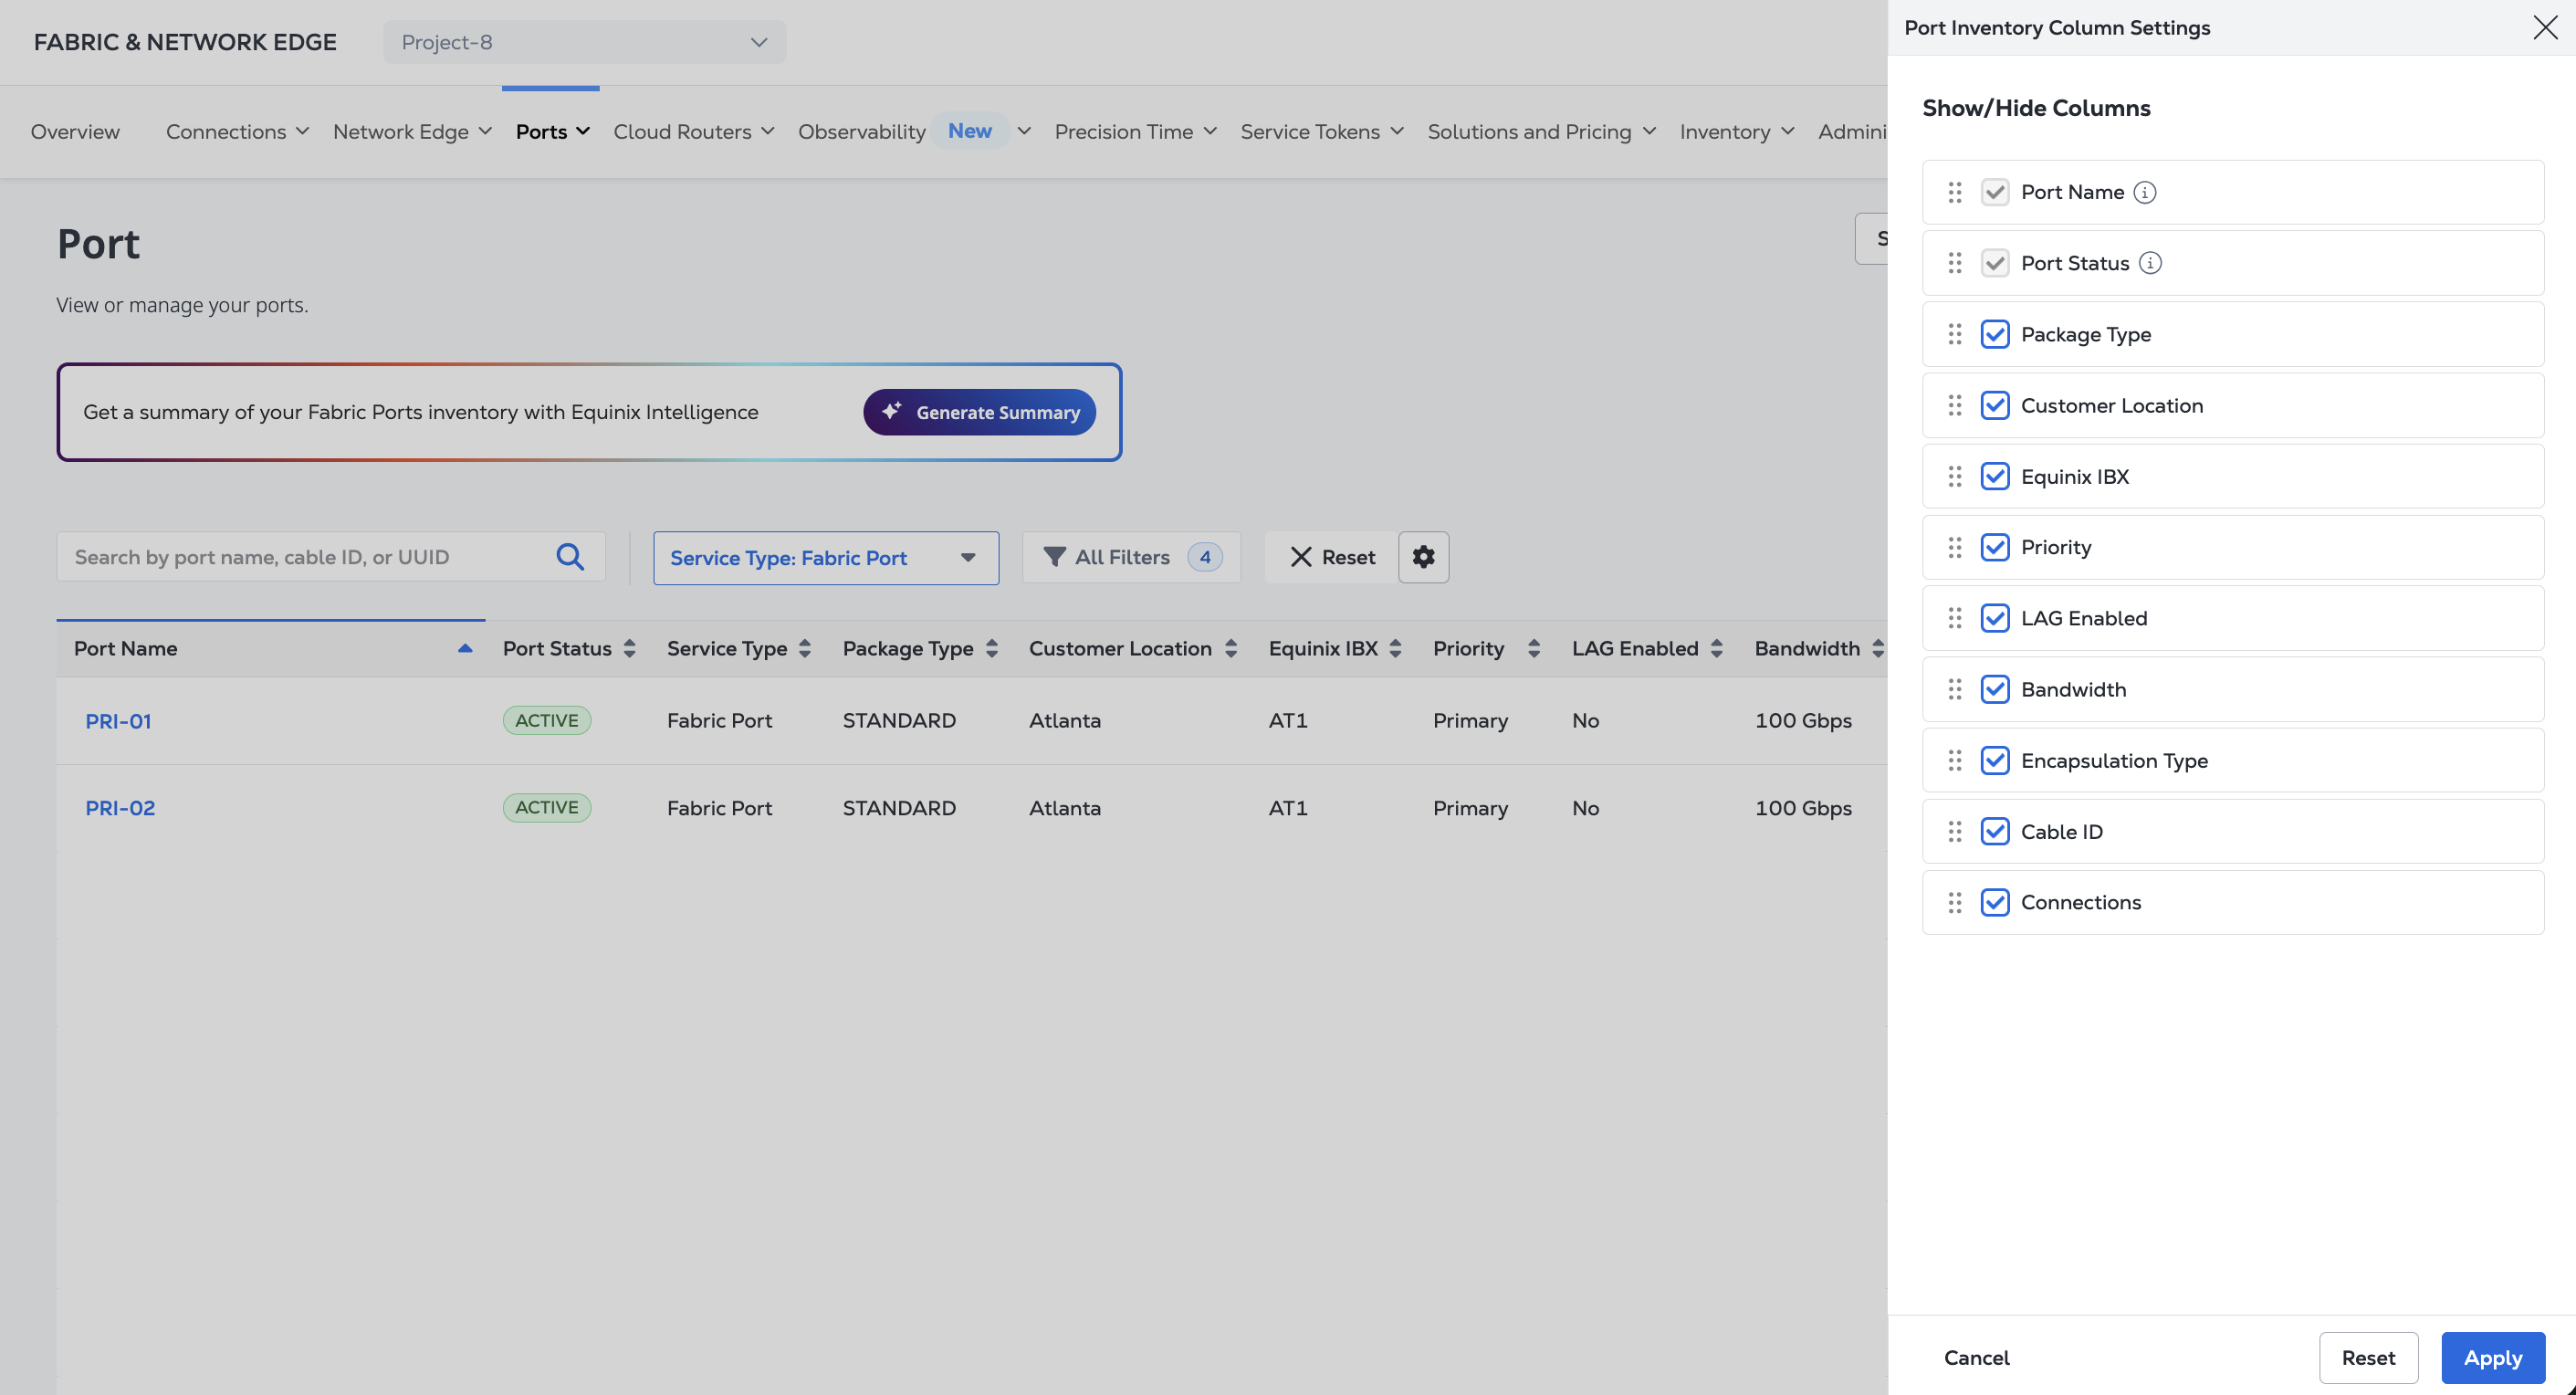
-
In the Port Inventory Column Settings drawer, select the columns you want to show and deselect the columns you want to hide.
-
To change the column order, click and hold a column name and drag it up or down.
-
Click Apply to save your column configuration.
-
Click Reset to restore the default column layout, which displays all columns with the Name and Status columns fixed.
Port Details
The port details page provides access to all the information about the selected port.
To view a port's details, locate the port in the Port Inventory table and click the port's name. Use the filter and search options help to quickly narrow your search if you have a lot of ports.
The Overview tab displays basic information about your port.
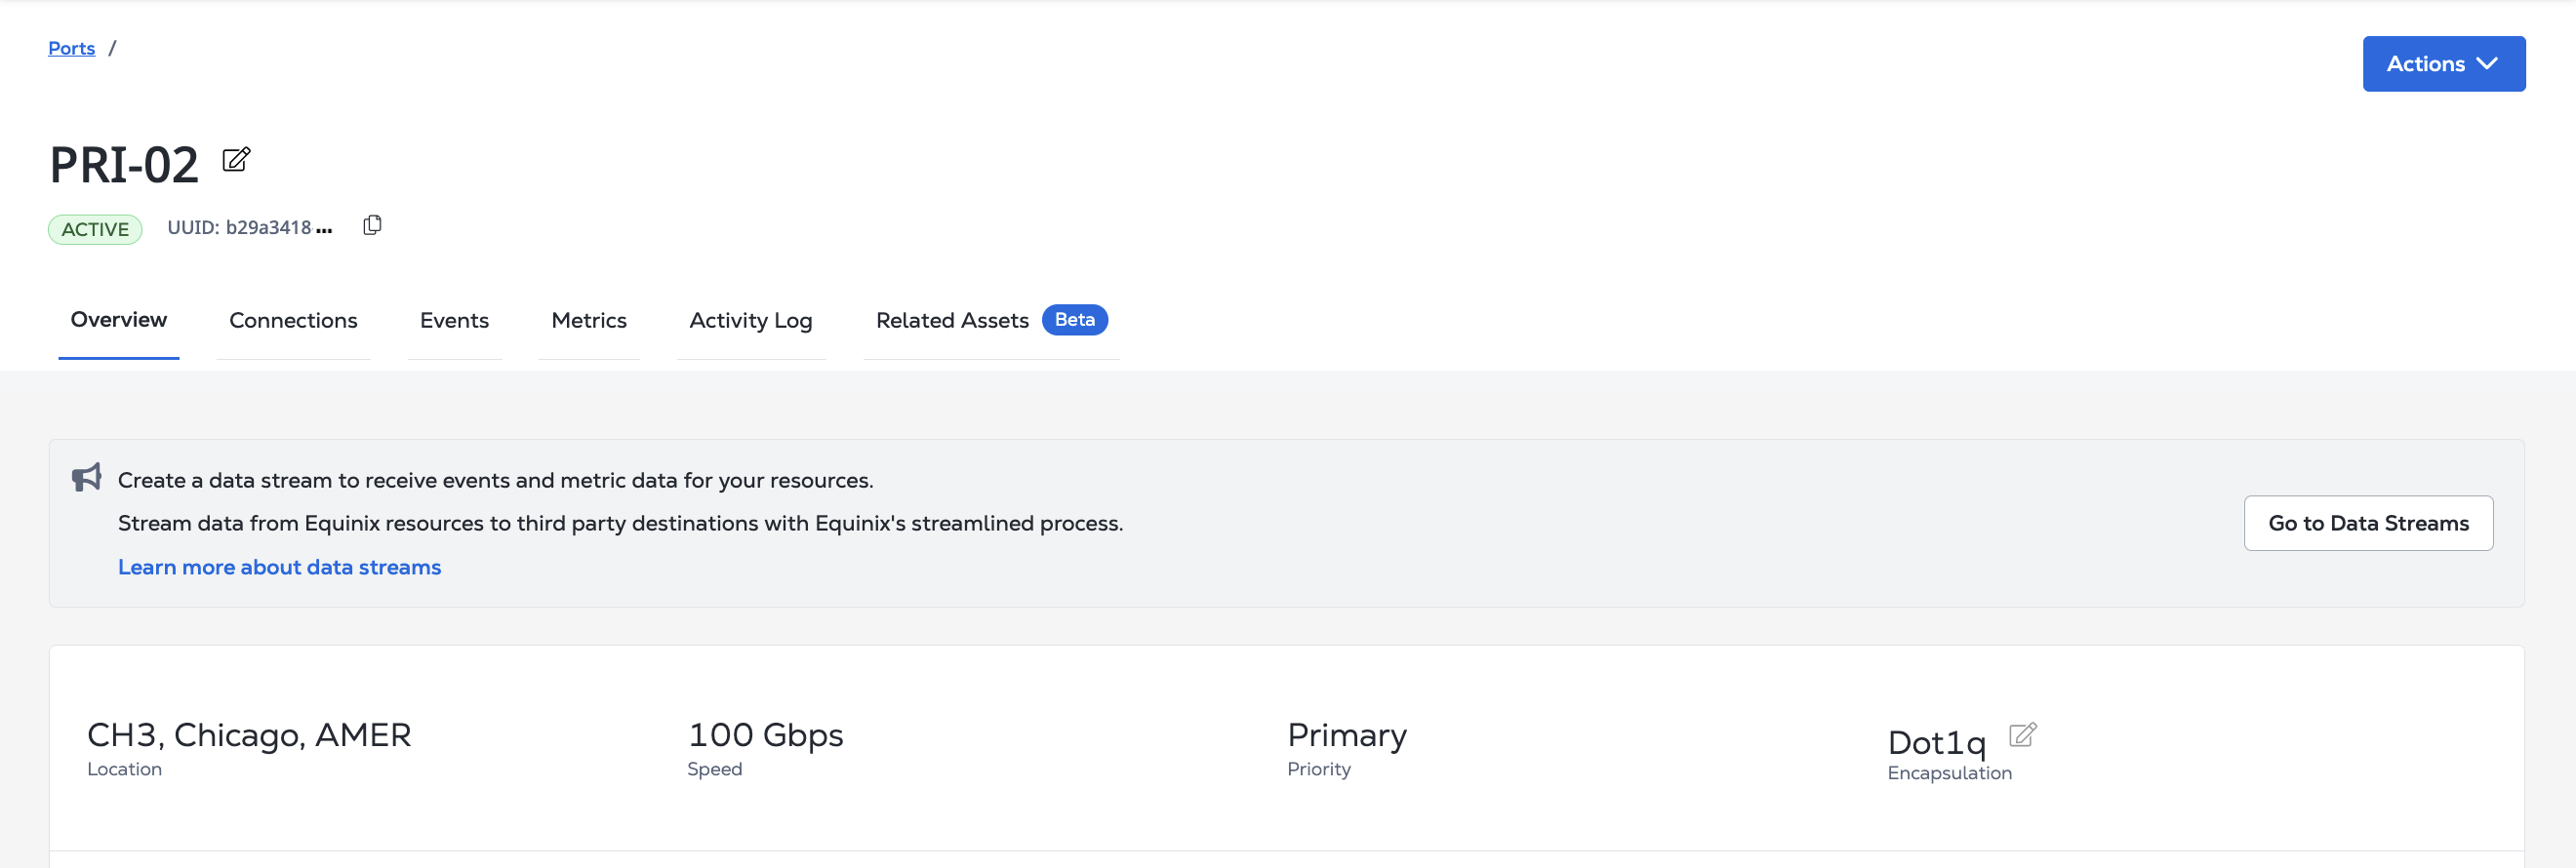
- Name
- Status (PROVISIONING, ACTIVE, REPROVISIONING, DEPROVISIONING, DEPROVISIONED)
- UUID
- Location
- Speed
- Priority
- Encapsulation
Click Actions to create a connection, enable LAG, open a trouble ticket, or delete the port. For more information, see Managing Your Fabric Ports.
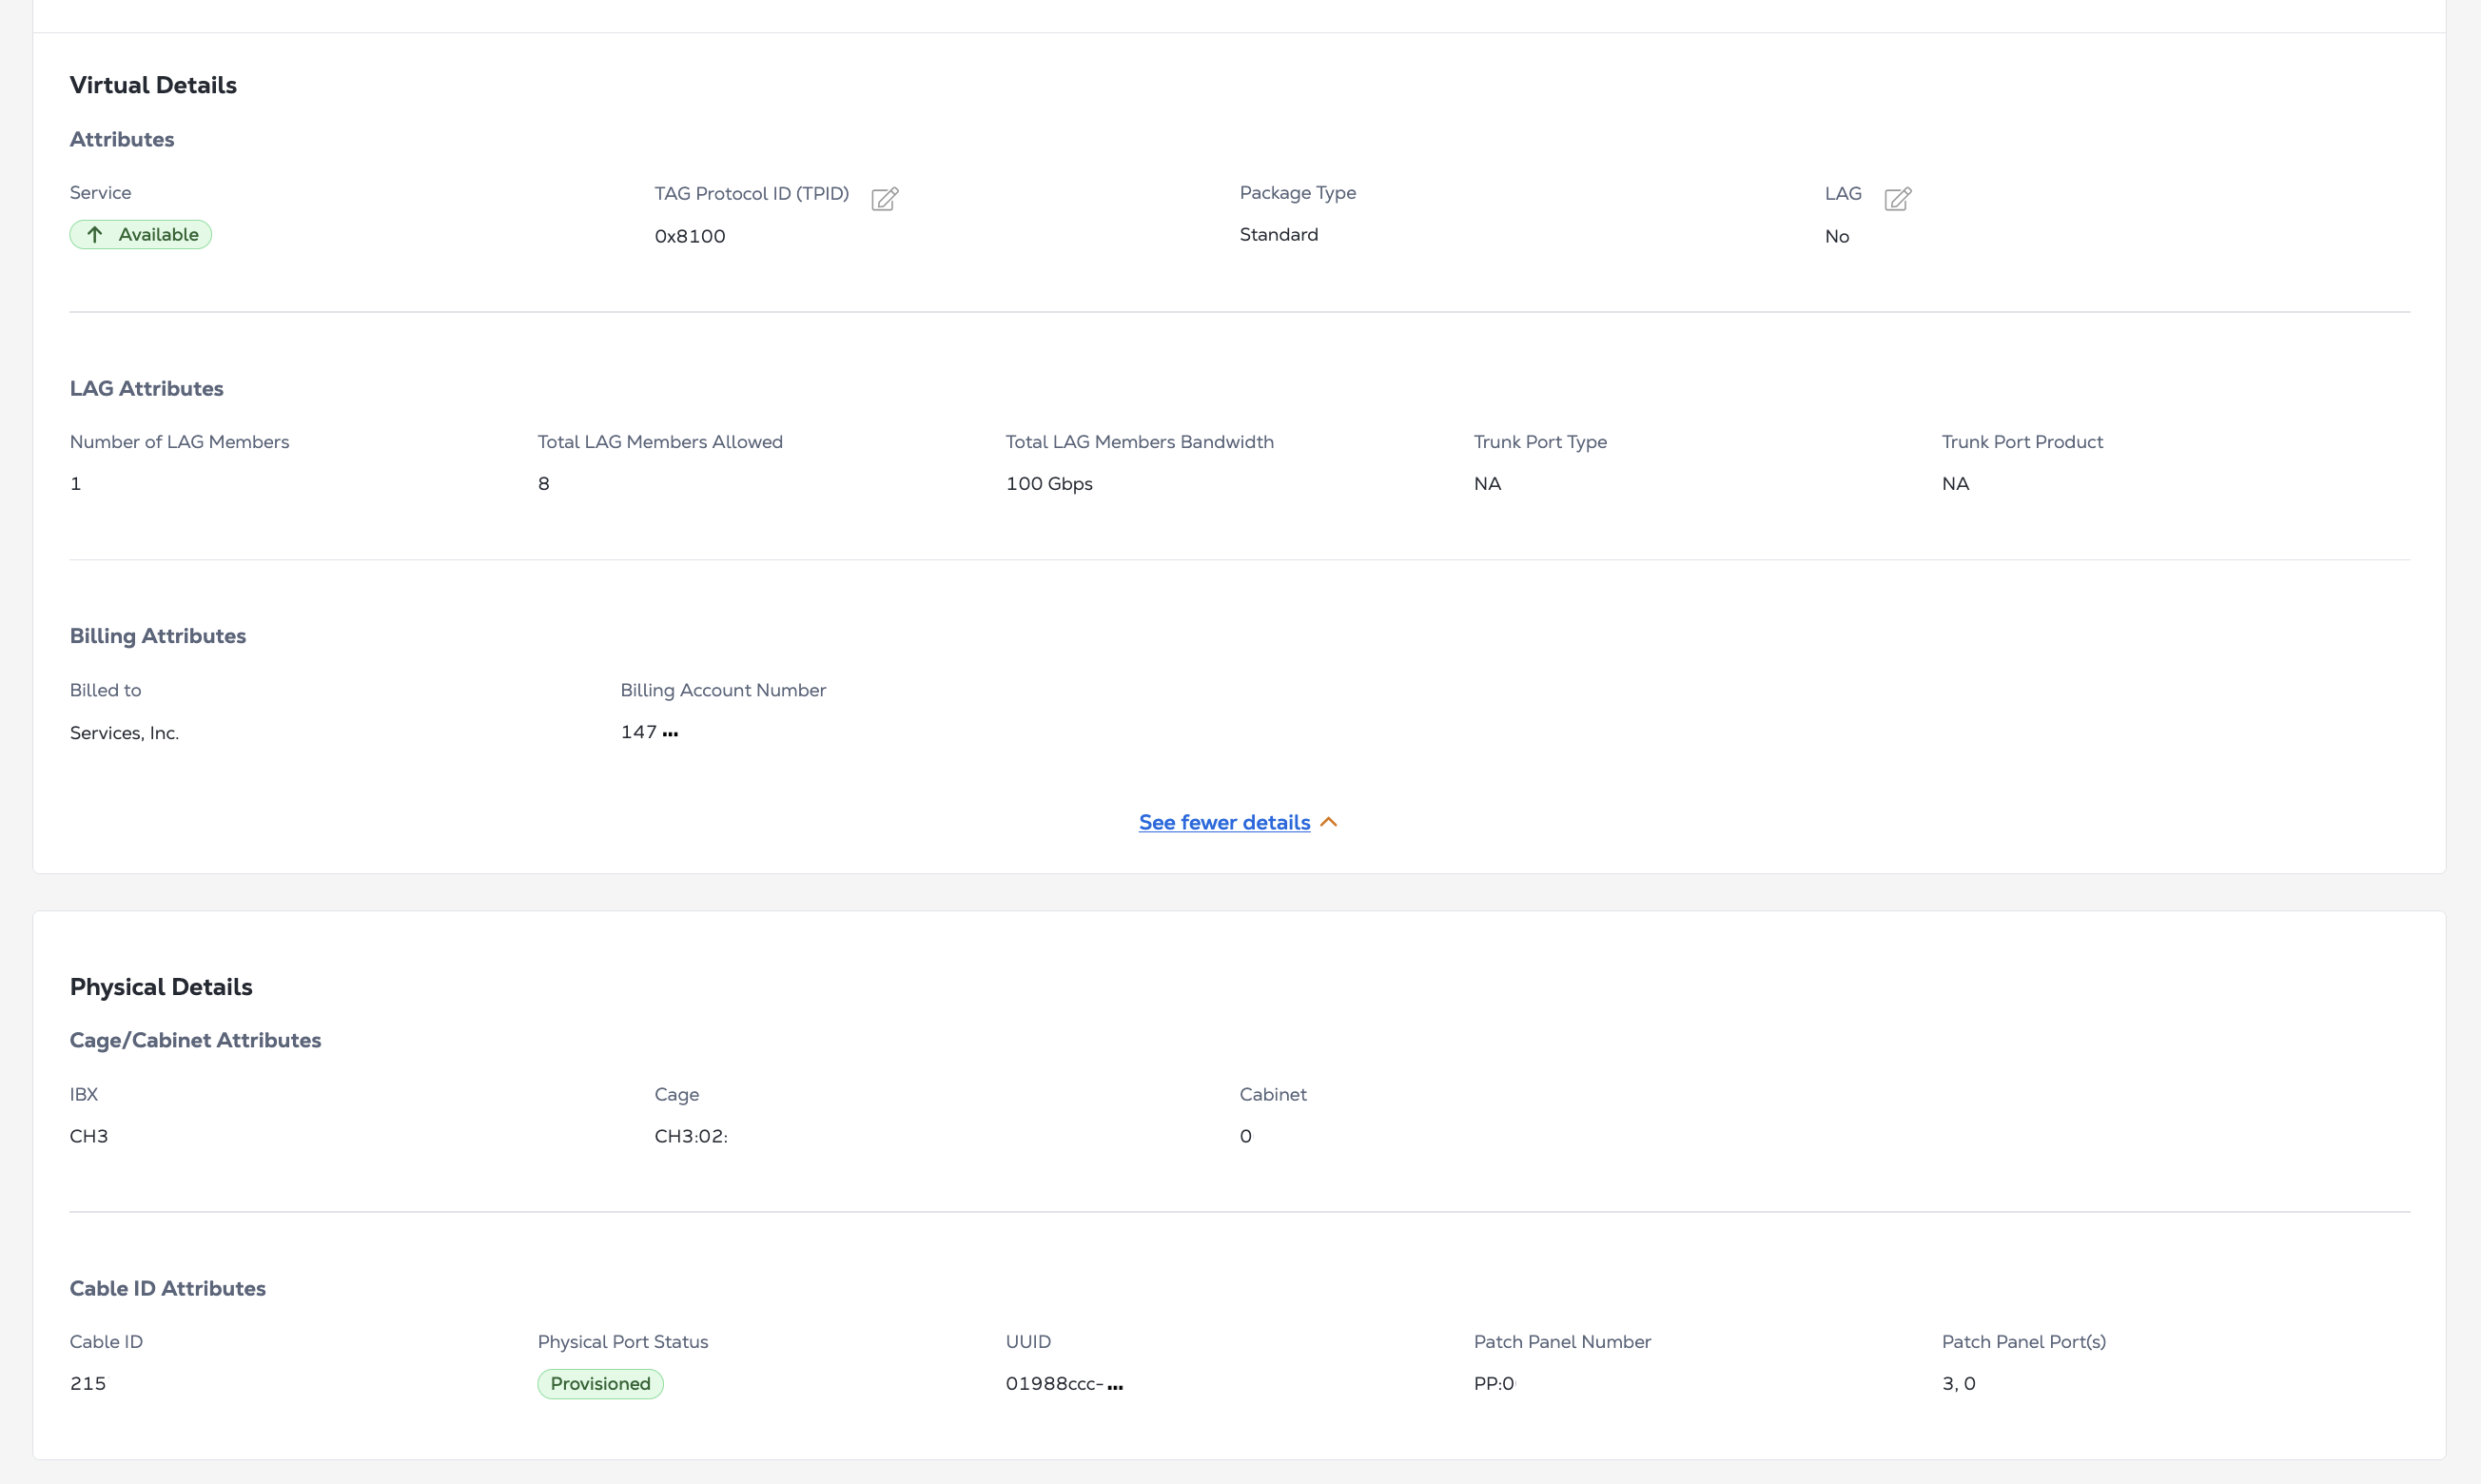
The Virtual Details section displays the virtual port information and details for this port.
- Service status
- TAG Protocol ID (TPID)
- Package Type
- LAG Indicator
Click See more details to expand the section.
LAG Attributes displays:
- Number of LAG Members
- Total LAG Members Allowed
- Total LAG Members Bandwidth
Billing Attributes displays the billing account name and number associated with this port.
The Physical Details section displays physical information about the port.
Cage/Cabinet Attributes displays:
- Physical Port IBX
- Cage
- Cabinet
Cable ID Attributes displays:
- Cable ID
- Physical Port Status (PROVISIONING, PENDING CROSS CONNECT, PROVISIONED, DEPROVISIONING, DEPROVISIONED)
- Physical Port UUID
- Patch Panel Number
- Patch Panel Port(s)
The Activity Log section is a quick summary containing the Last Modified and Created On dates. More detailed information is available on the Activity Log tab.
The Port Details page is also where you can manage some your port's attributes and configuration. See Managing Your Fabric Ports for more information.
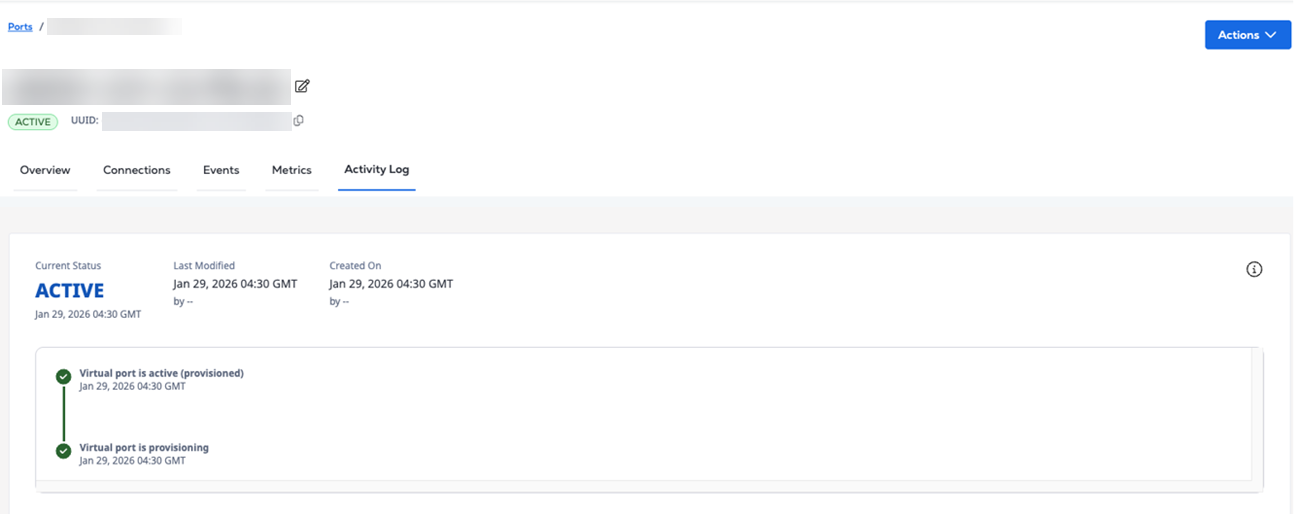
Port Activity Log
The Port Activity Log provides a chronological record of lifecycle events and configuration changes for an individual port. The top of the activity timeline displays the current port status, along with the last modified and created dates for quick reference.
The timeline view helps you track provisioning progress, updates, failures, and other operational activity for troubleshooting and auditing purposes.
Each activity entry includes:
- Event name and status
- Timestamp (GMT)
- Additional details, when available, accessible in the See More Details dropdown.
To access the Activity Log:
-
In the Ports Inventory table, click a port name to access its details.
-
Click Activity Log and expand an activity entry to view more information.
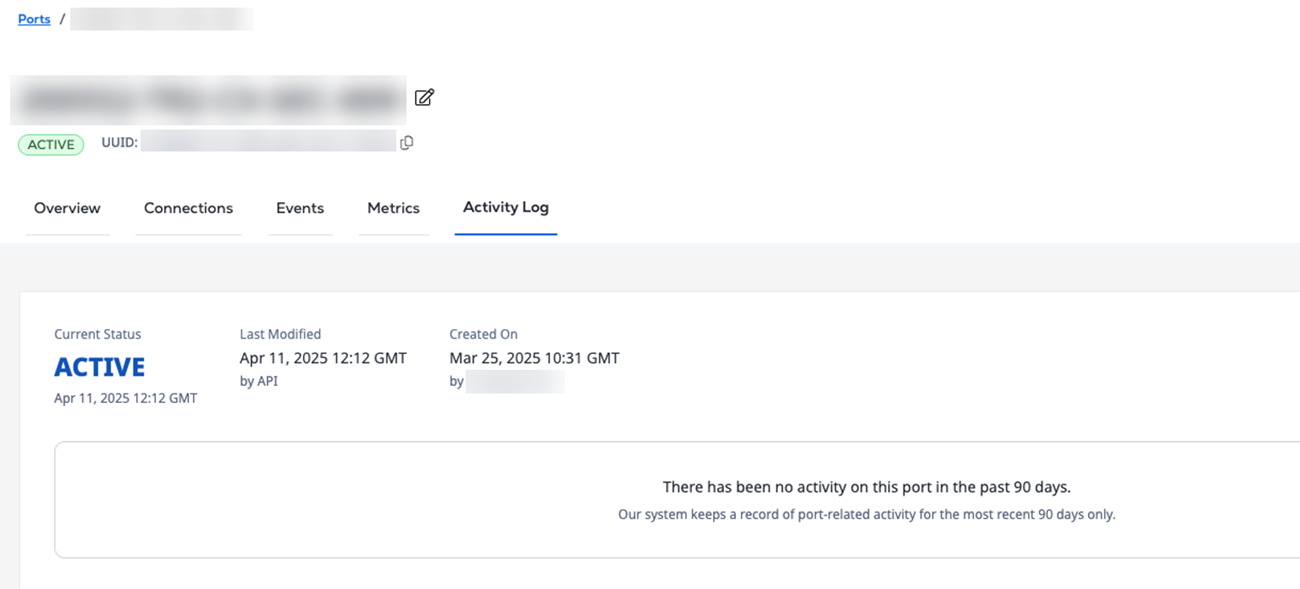
The Activity Log retains port activity for the most recent 90 days. If no activity has occurred during this time, the log displays a message indicating that no activity is available.
Related Assets
The Related Assets tab provides a consolidated view of resources associated with a port, enabling visibility into how the port is used across the network.
The following asset types are visible in the table.
- Connections – Lists all connections associated with the port, including details such as connection name, status, destination, location, direction, utilization, and bandwidth.
- Service Tokens – Displays service tokens linked to the port that can be used to establish connections.
- Service Profiles – Shows service profiles available or associated with the port for connectivity.
To access related assets:
-
In the Ports Inventory table, click a port name to access its details.
-
Click Related Assets.
-
Click Connections, Service Tokens, or Service Profiles to view the associated resources.
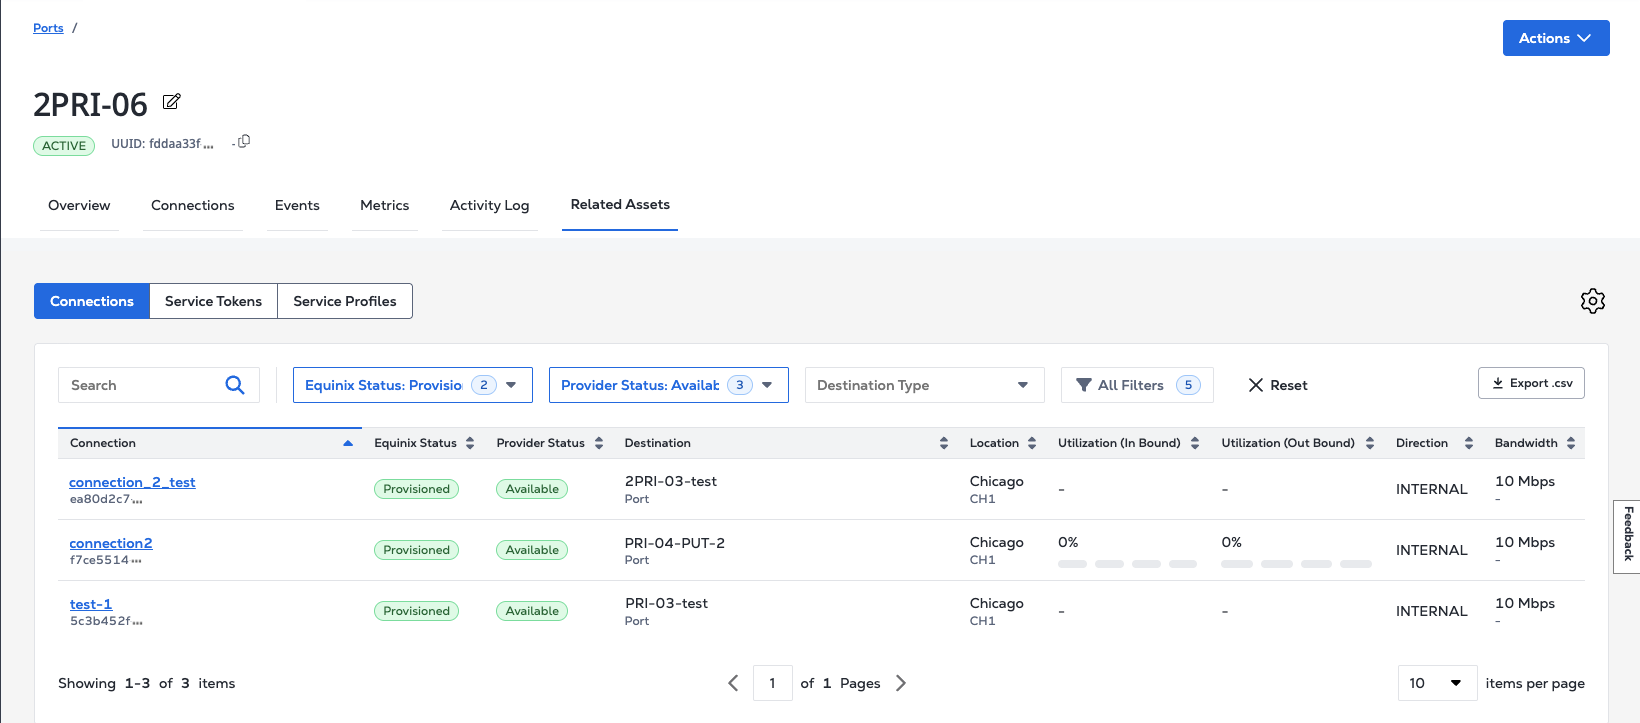
Search, filtering, and export options are available within each tab to refine and manage the displayed data.