Connections Inventory
The Fabric Connections Inventory provides a single location for viewing all of your connections and accessing details for each connection.
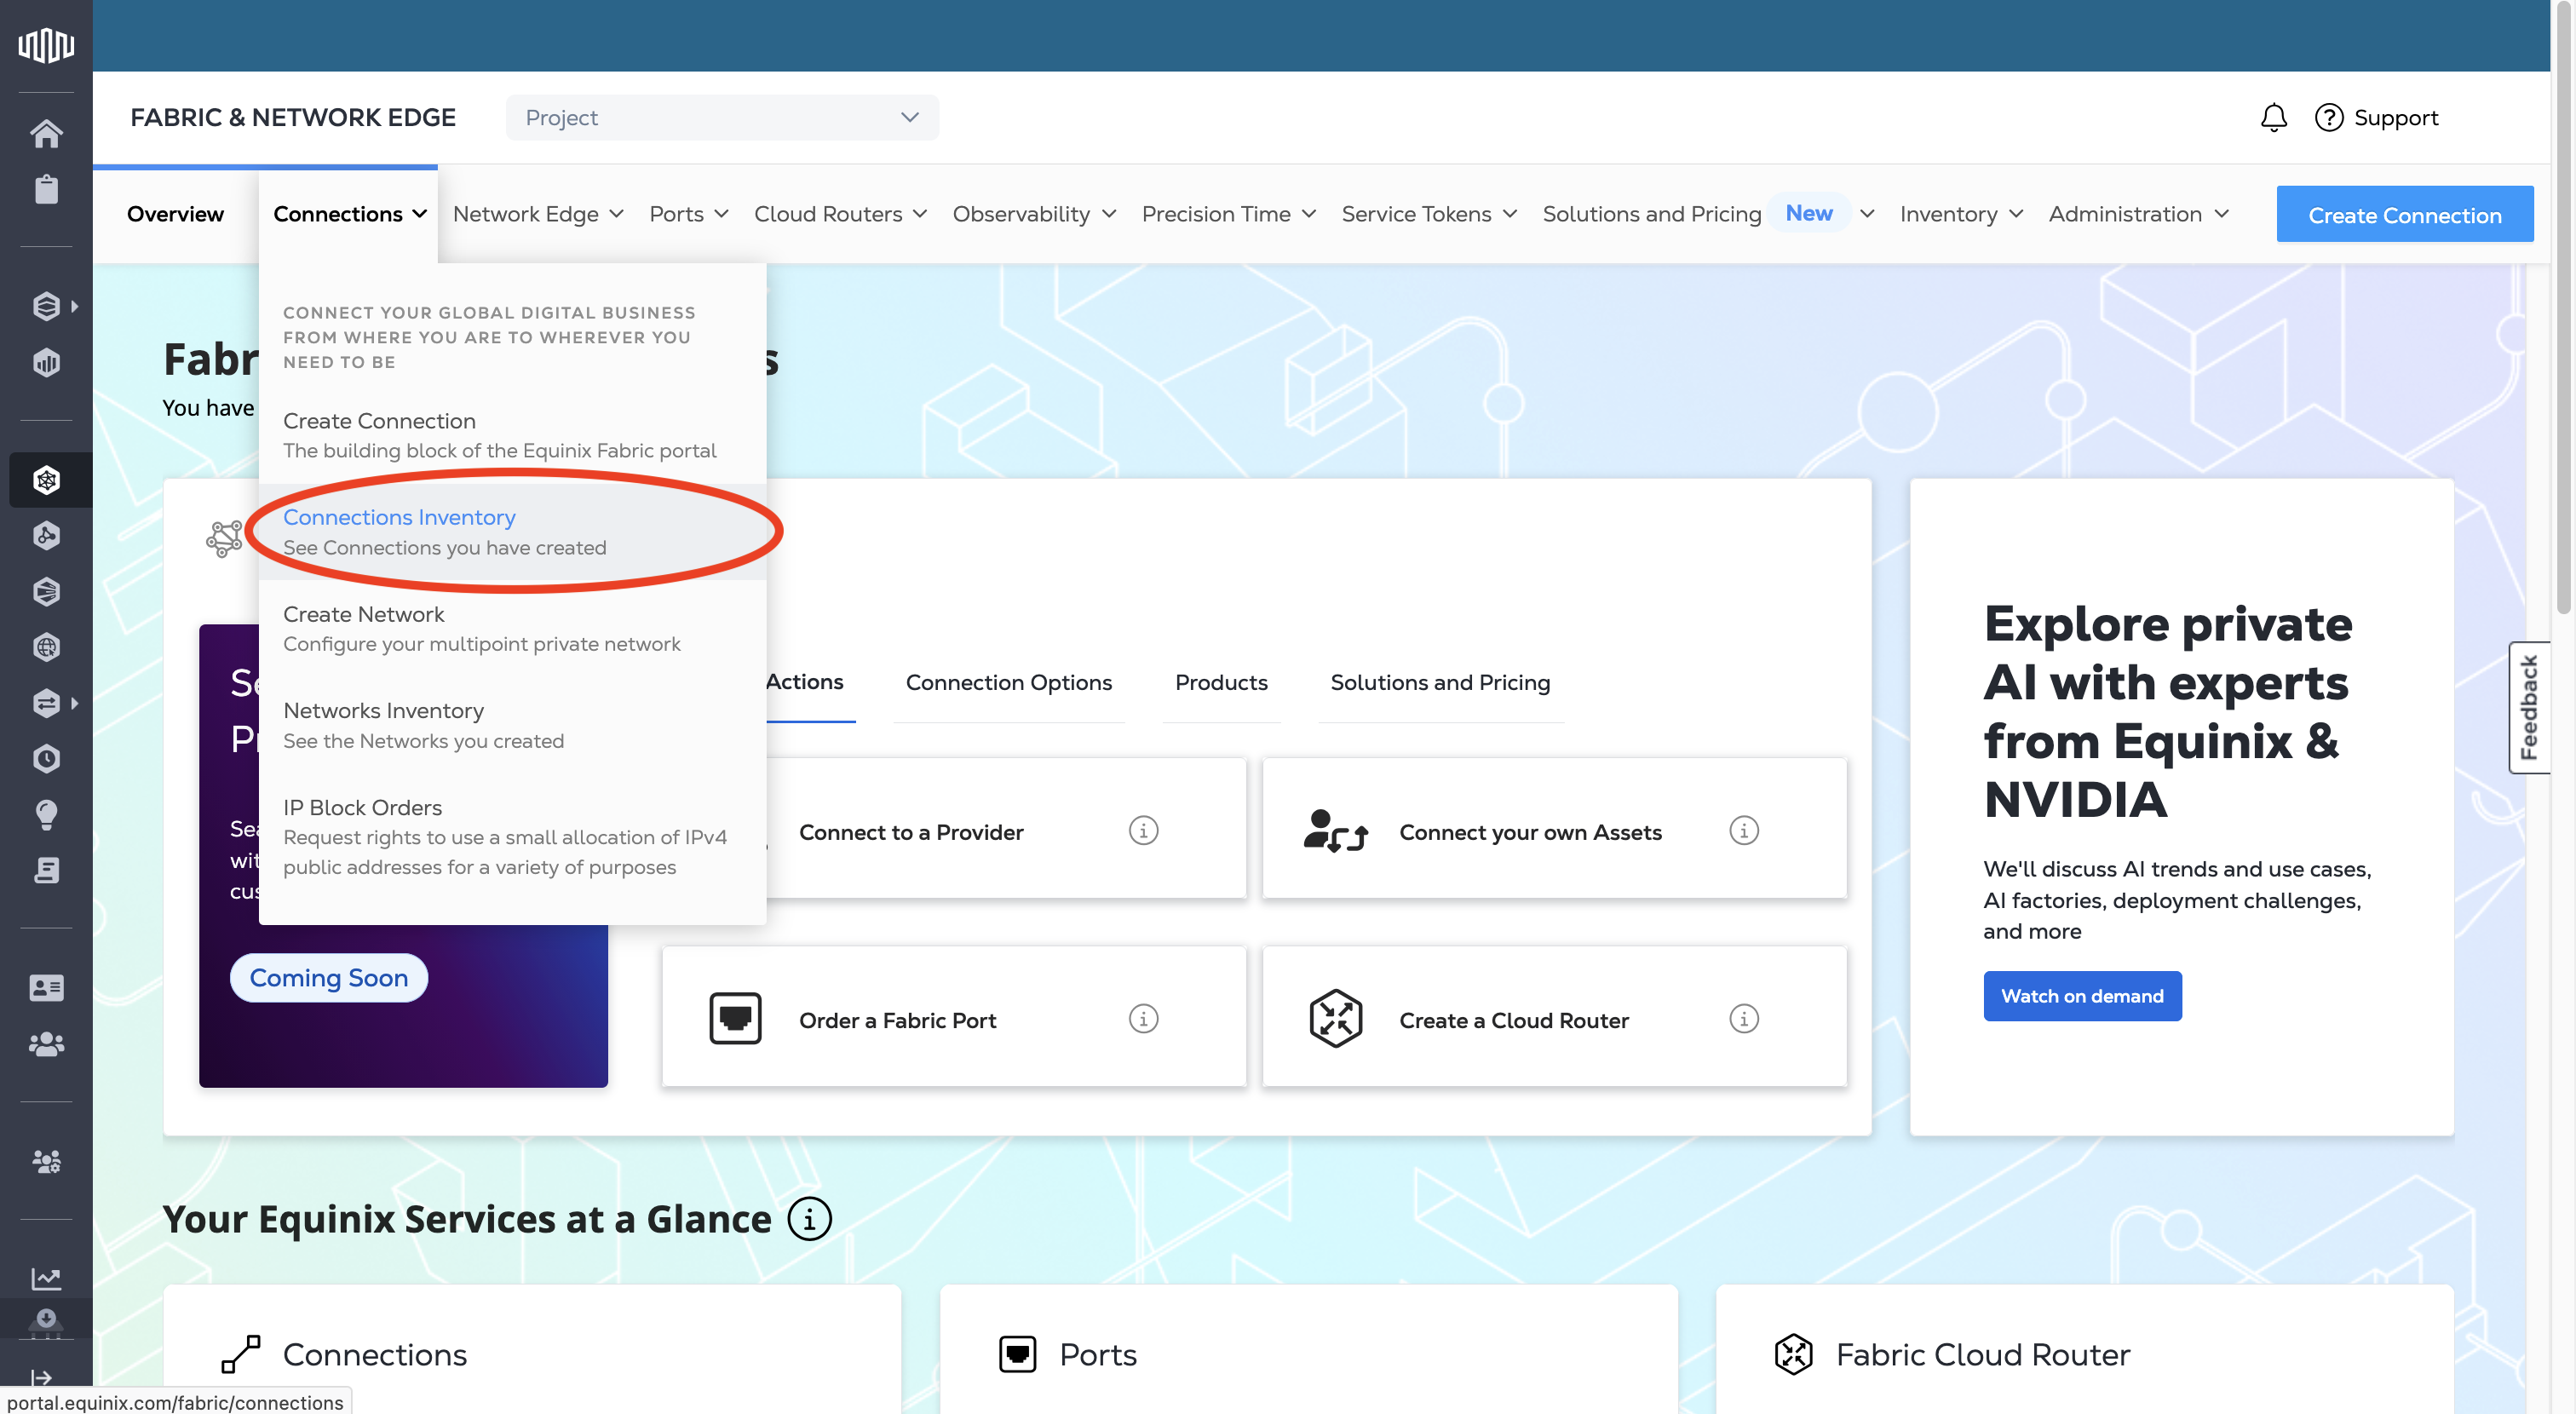
To access the Connections Inventory:
-
Sign in to the Customer Portal --> Fabric Dashboard.
-
From the Connections drop-down menu, select Connections Inventory.
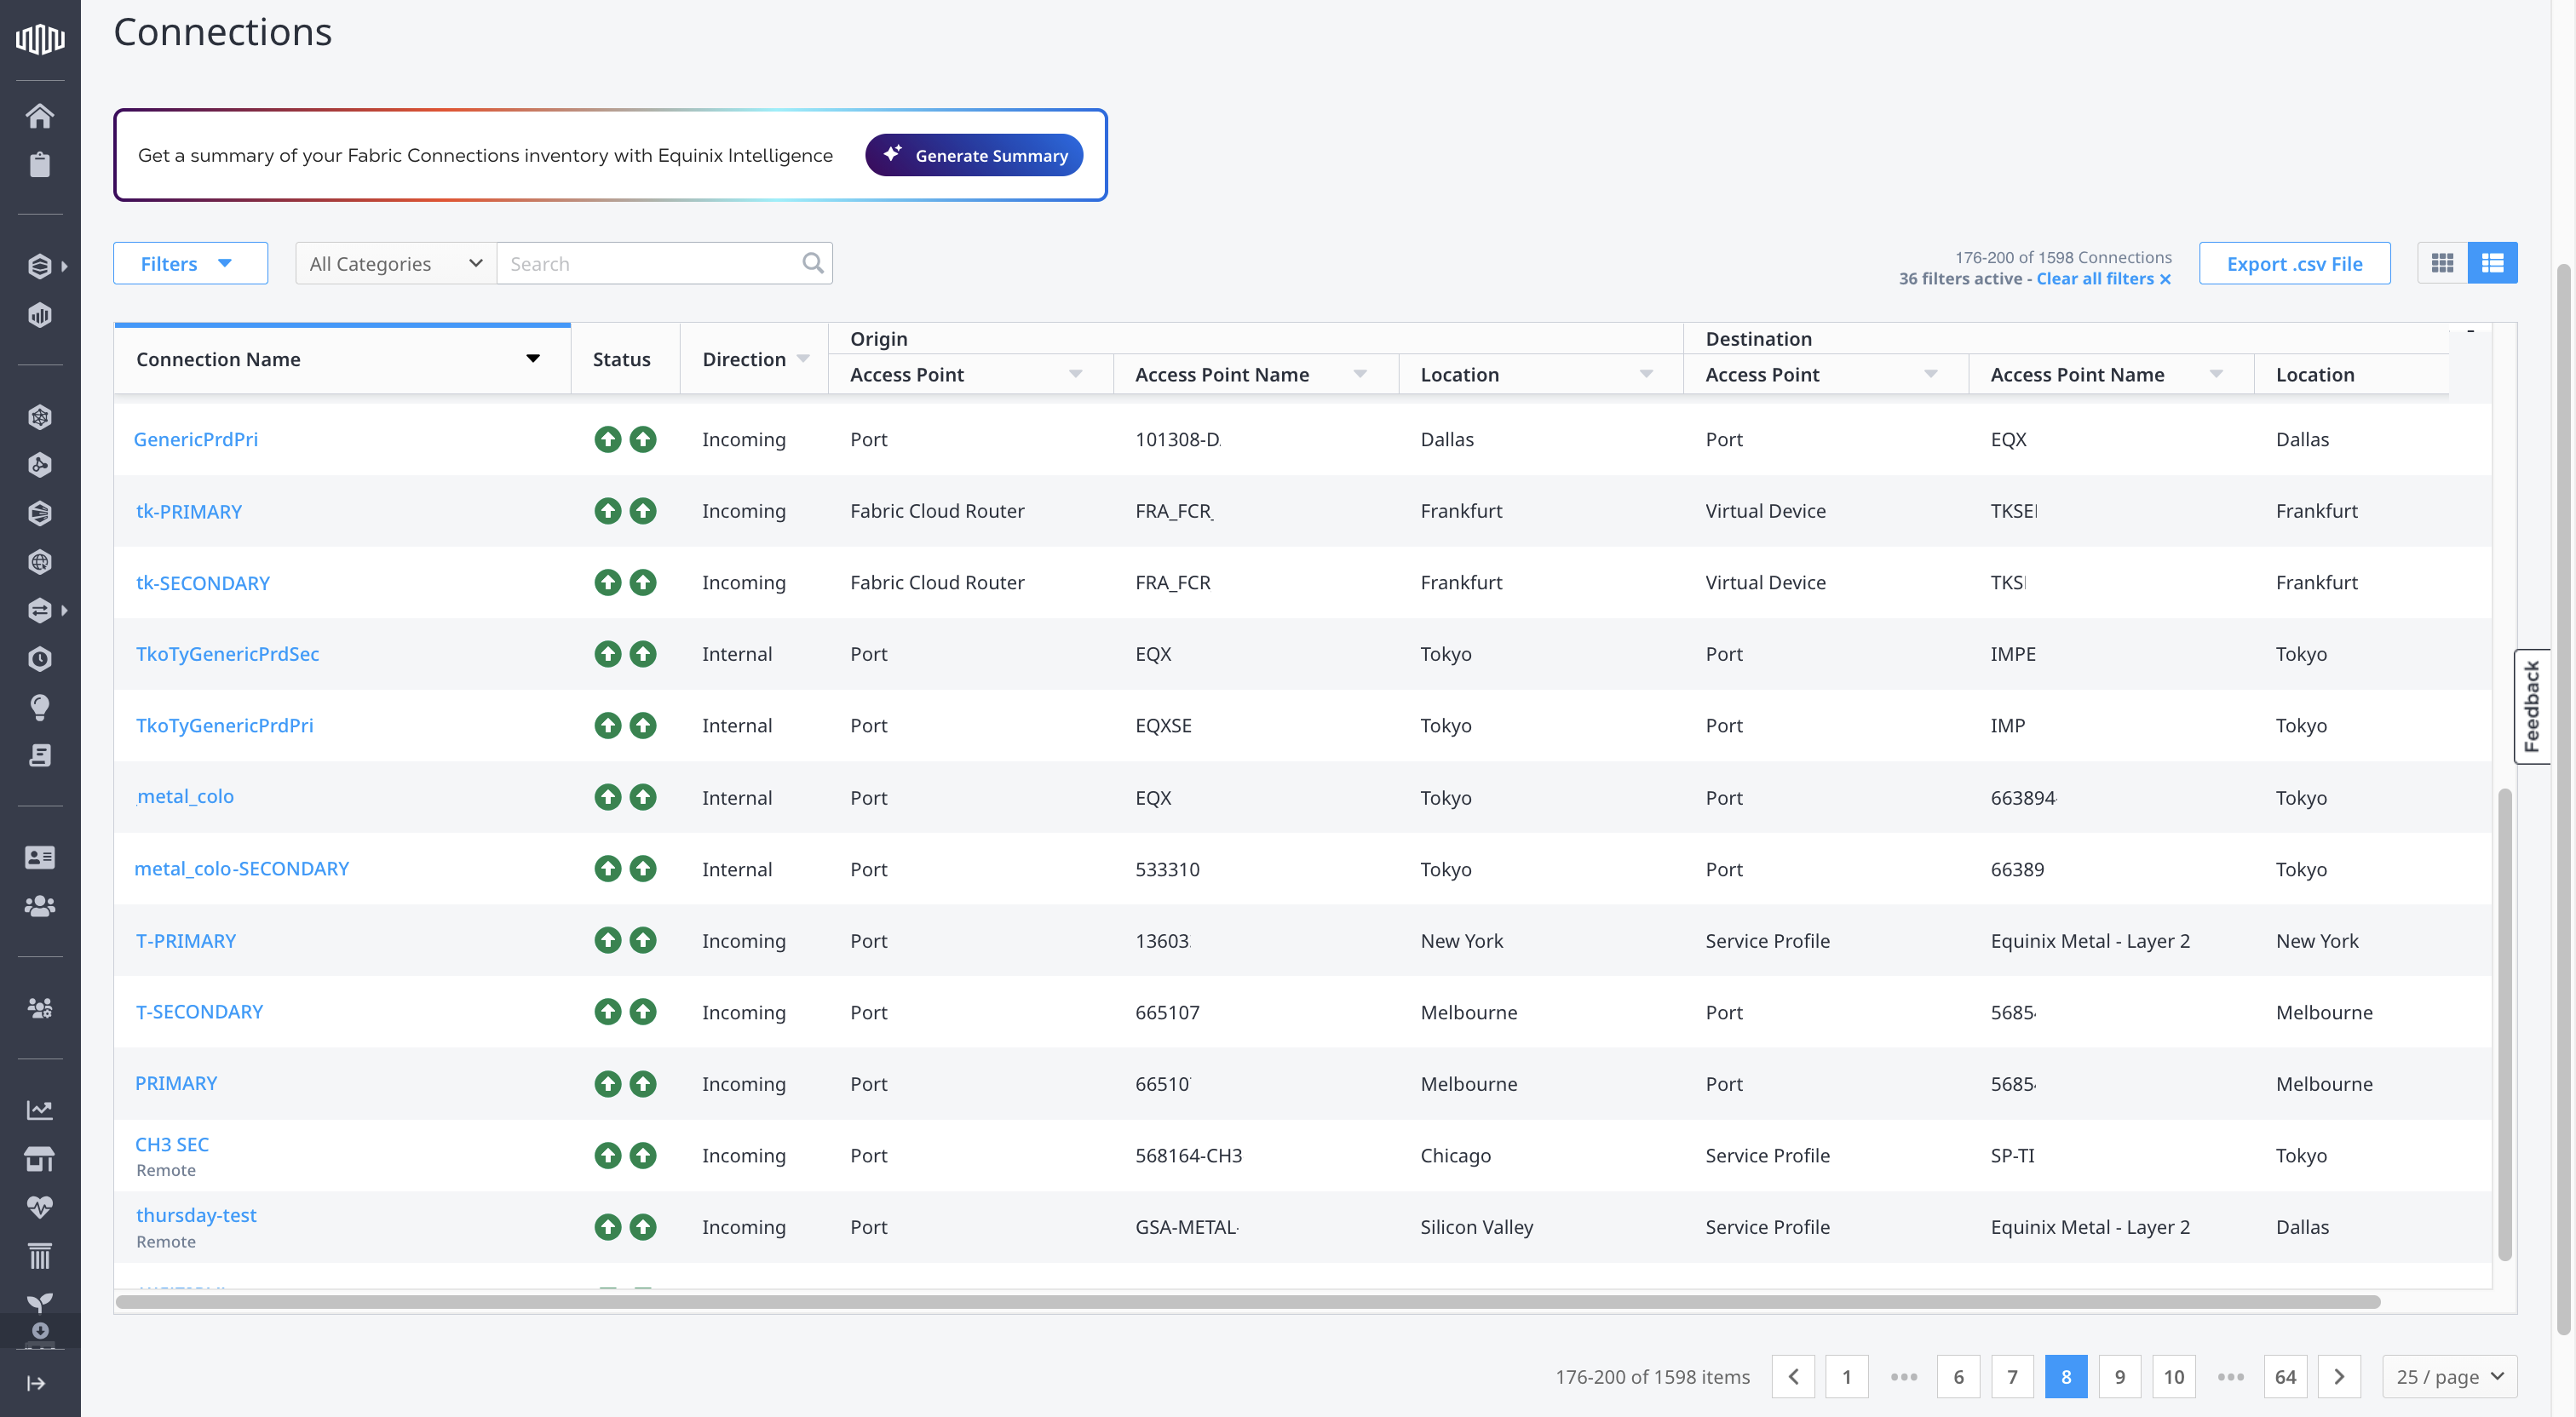
The Connections Table
The Connections table displays all of your connections along with a subset of information that is sortable, filterable, and searchable.
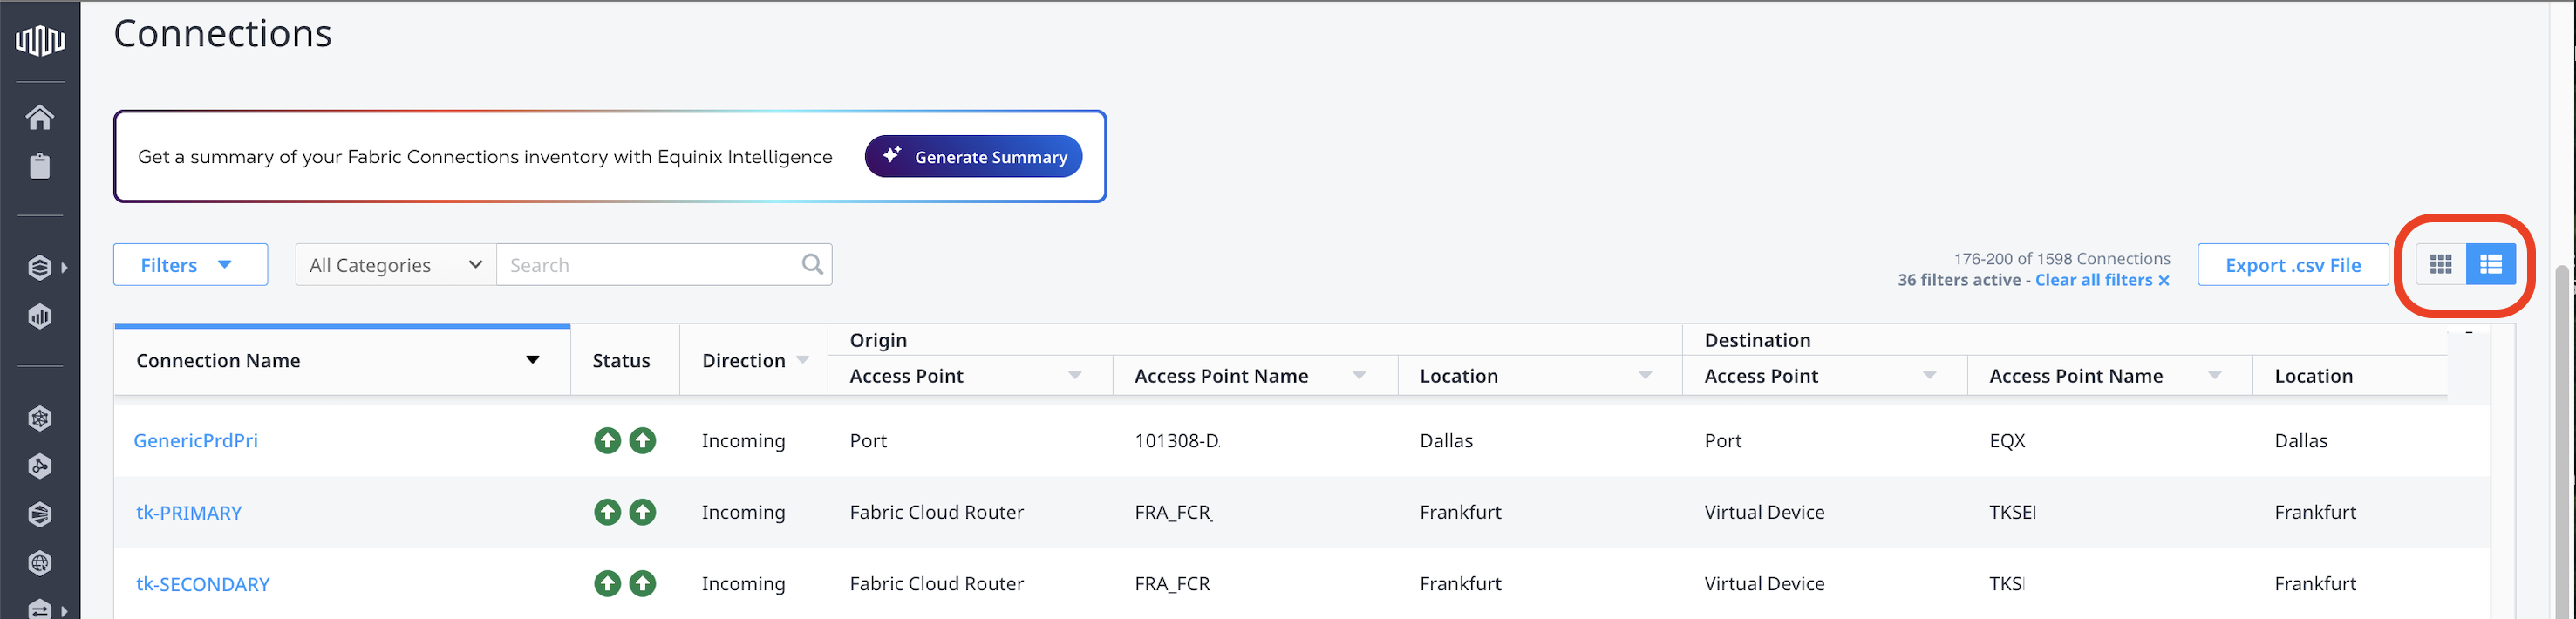
View
Click the tiles icon to view each connection in a separate tile, or click the list icon to view a list of connections.
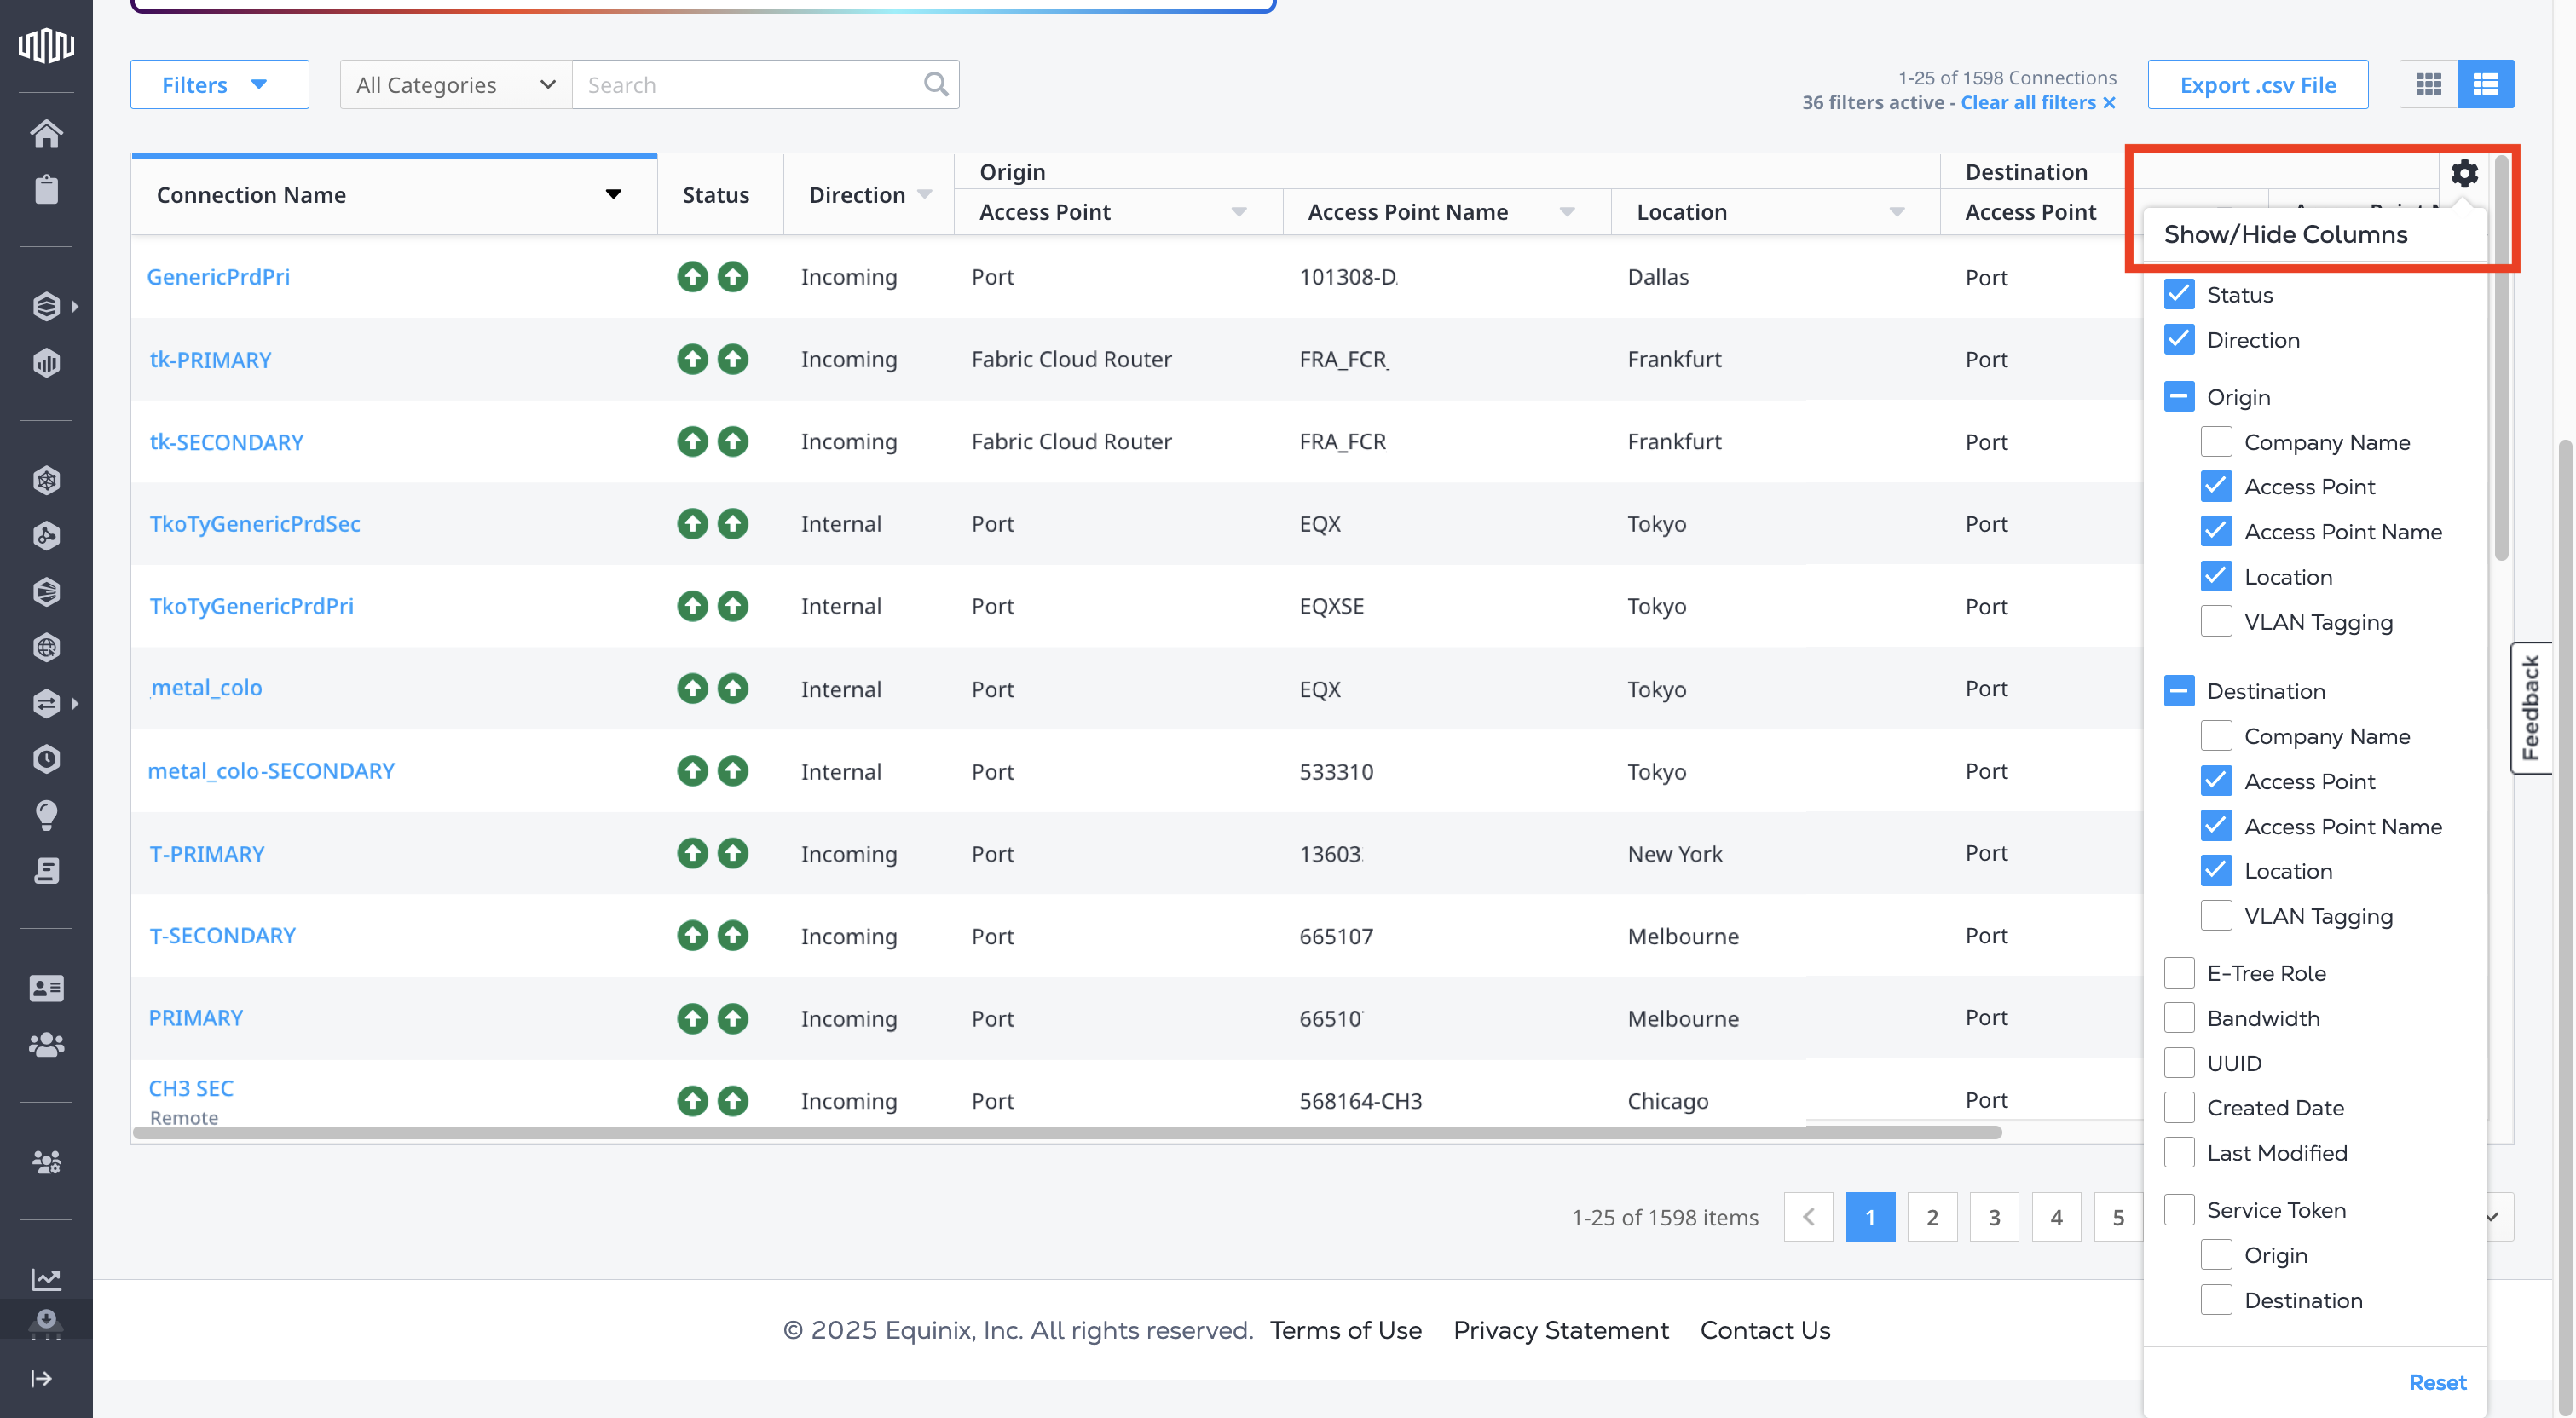
Show/Hide Columns
You can customize the information columns that display in your list view by clicking the settings icon and selecting or deselecting columns.
Search
Use the search field to narrow your connection list. The drop-down list allows you to choose specific categories.
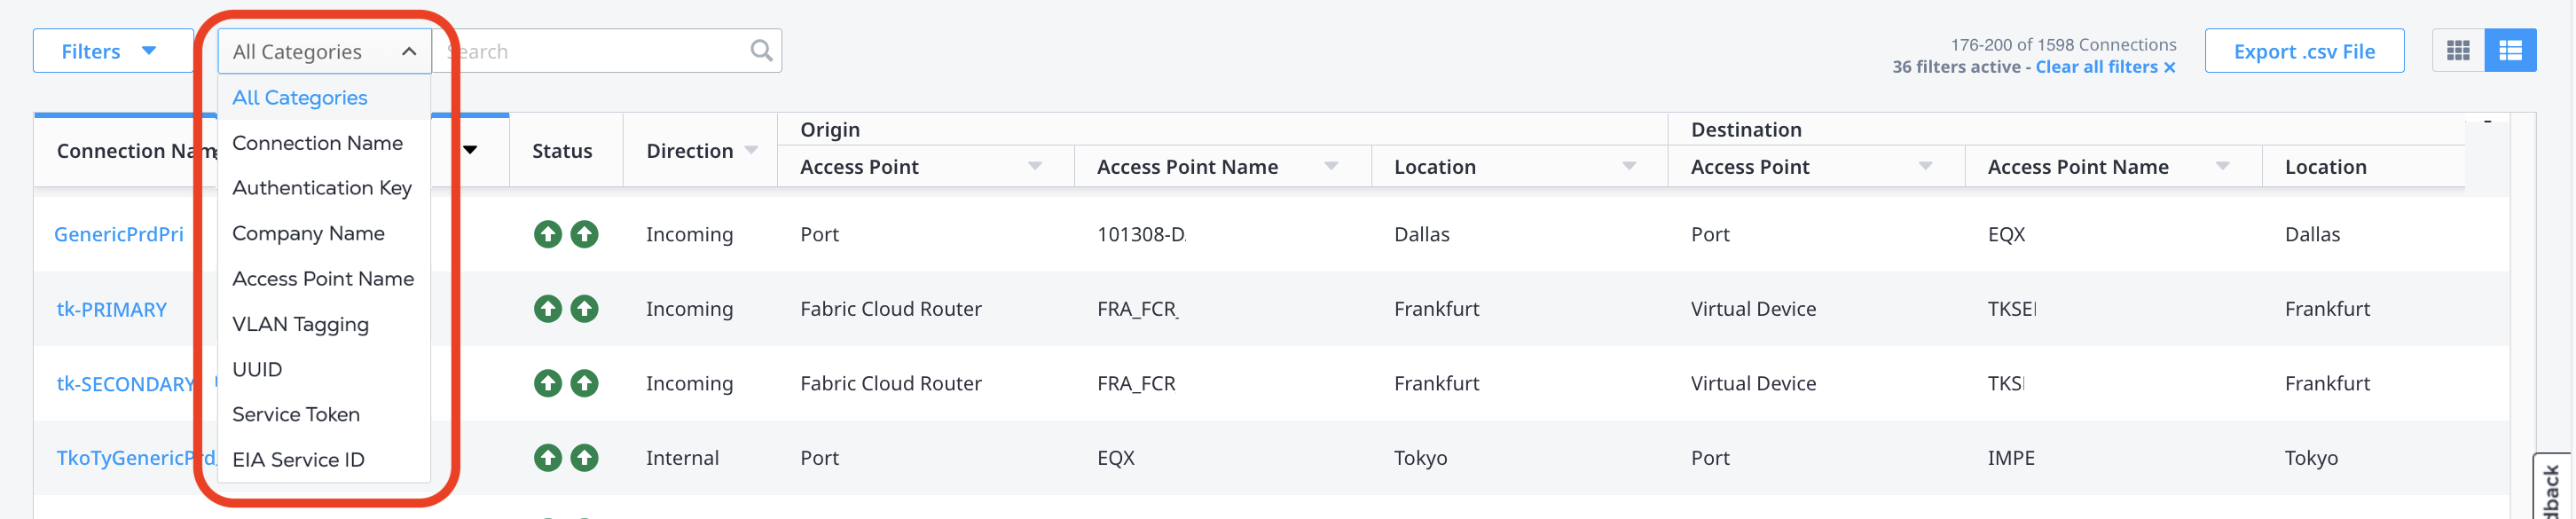
- Connection Name – search for connections with a specific connection name.
- Company Name – search for connections with a specific company name.
- Access Point Name – search for connections with a specific access point name such as a Port name, Fabric Cloud Router Name, or virtual device name.
- VLAN Tagging – search for connections with a specific VLAN ID.
- UUID – search for connections with a specific UUID.
- Service Token – search for connections that require a service token.
- EIA Service ID - search for Internet Access connections by their Internet Access service UUID.
Filtering
Use the advanced filter options to narrow your search to specific criteria.
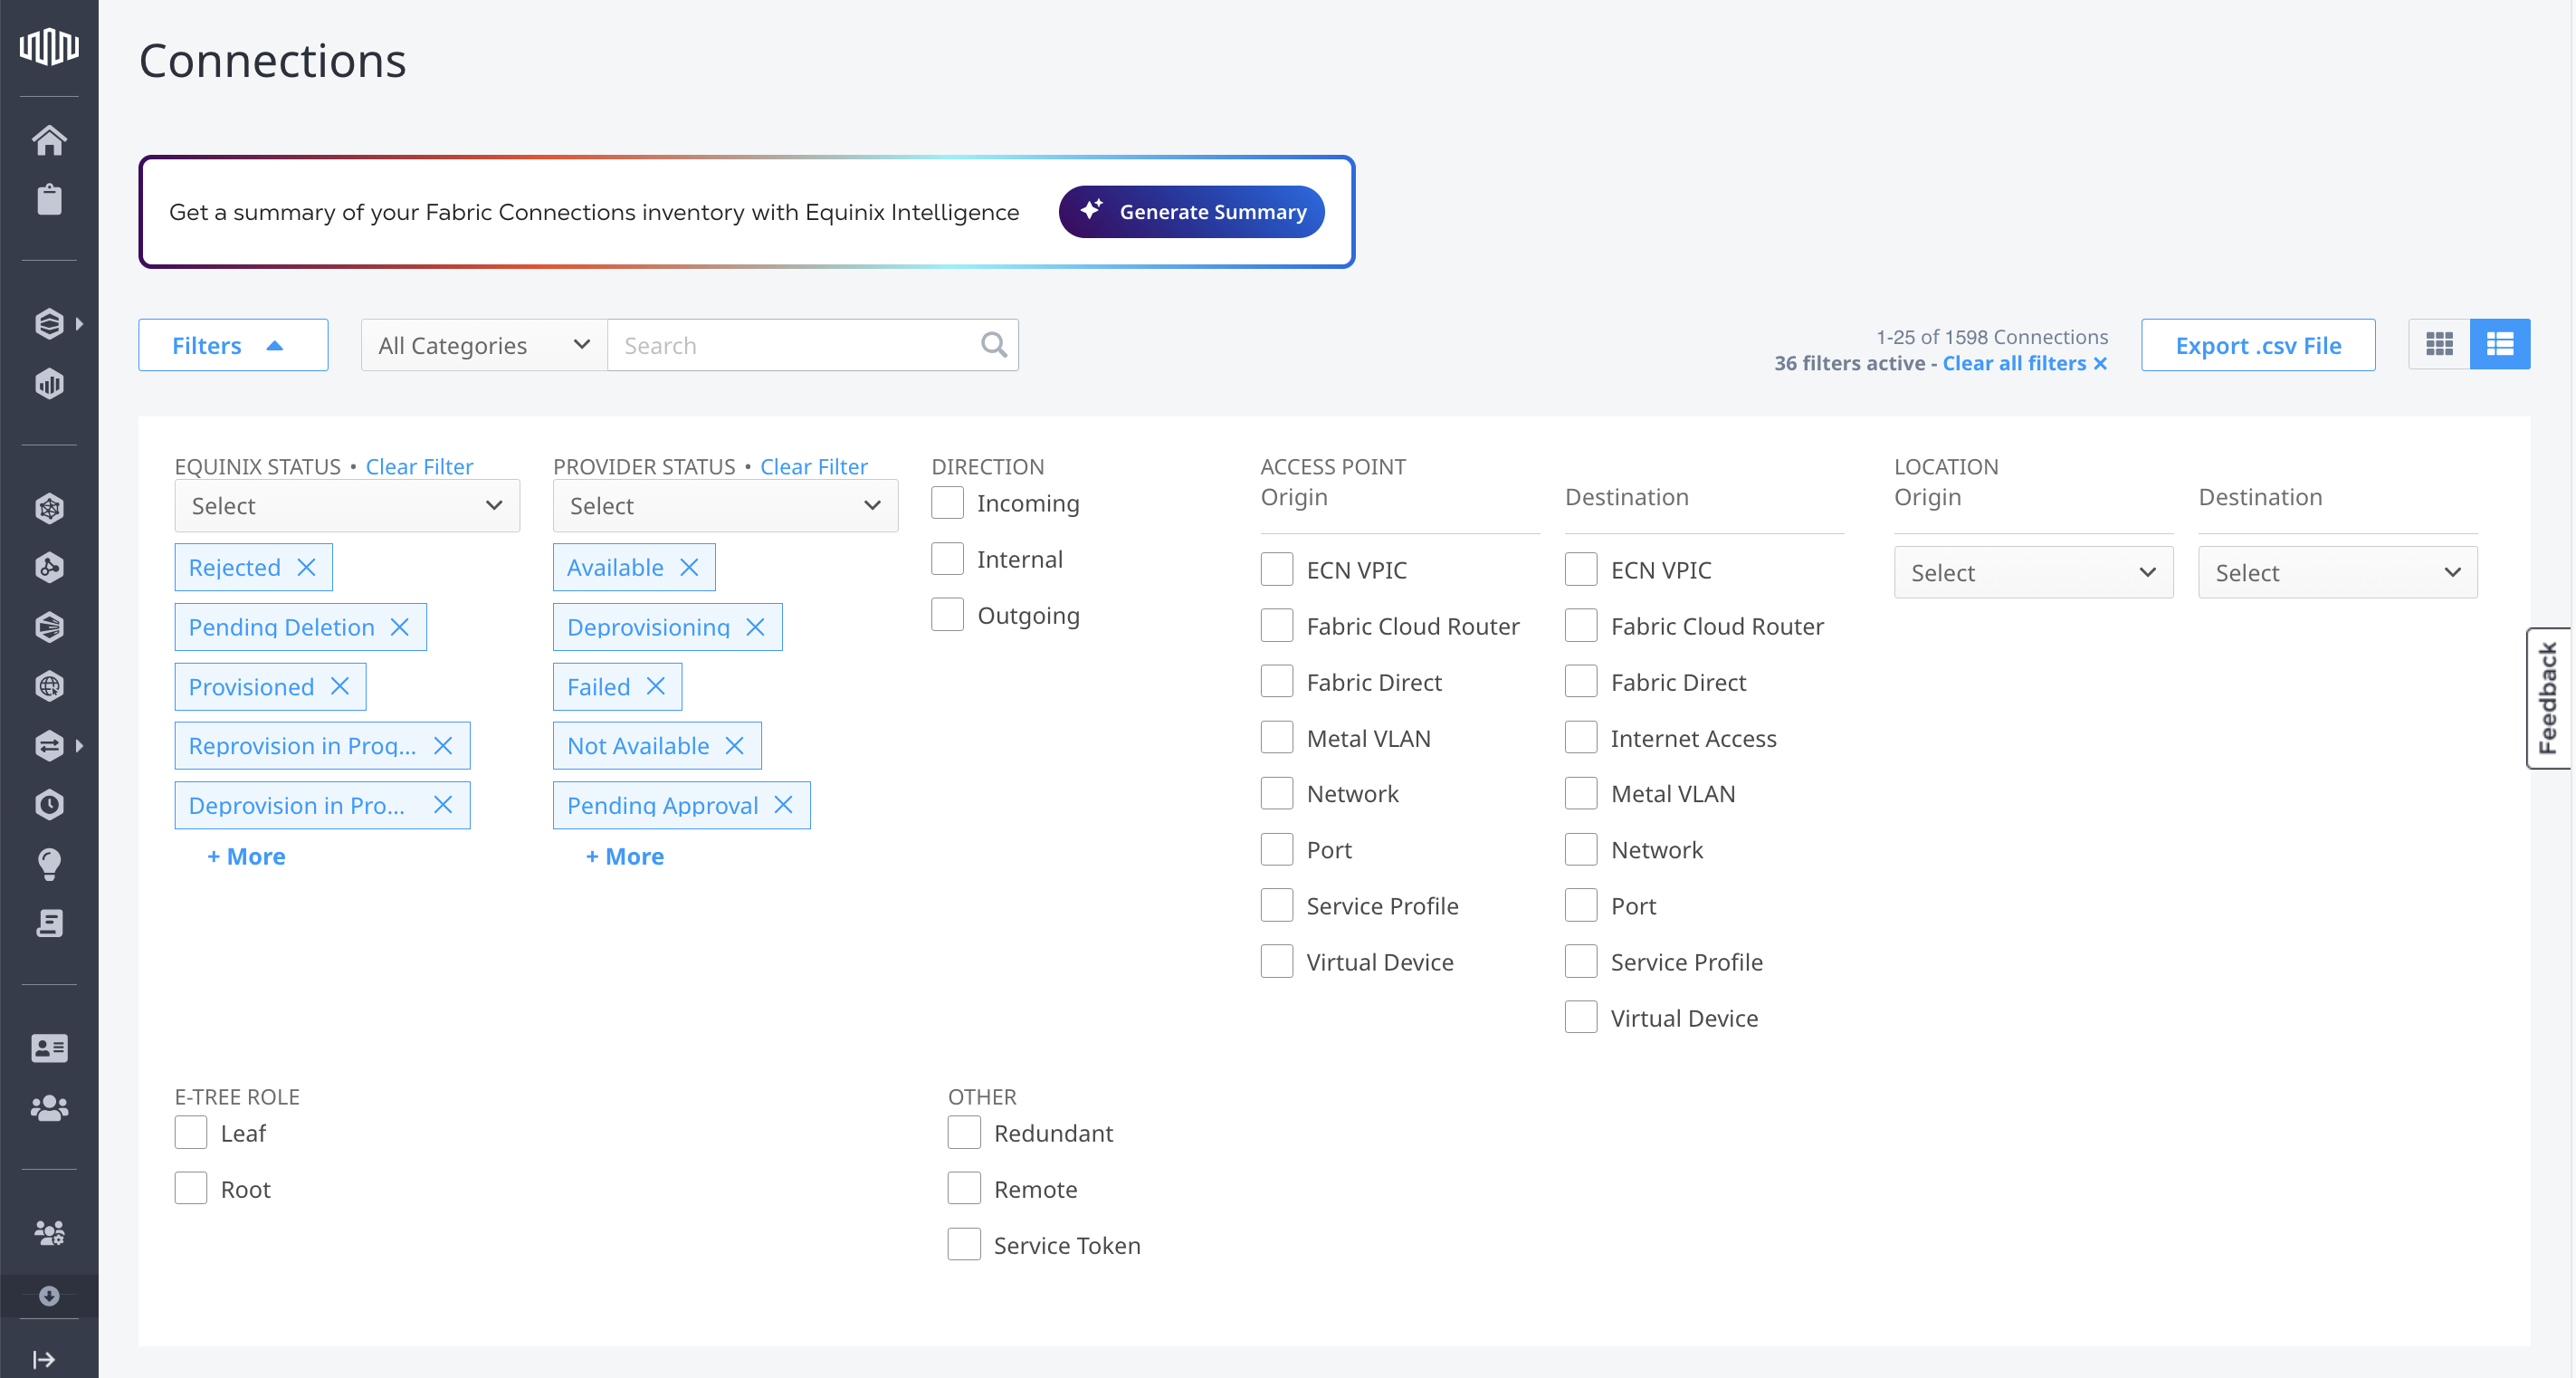
- Equinix Status – Use the drop-down list to select a status. Click a status to delete it from your search.
- Provider Status – Use the drop-down list to select a status. Click a status to delete it from your search.
- Type – Select a connection type (Incoming, Internal, or Outgoing).
- Access Point – Select Origin or Destination access point, or both.
- Location – Select an available origin location or destination location.
- E-tree Role - Filter connection by e-tree role.
- Other – Select Remote to see all your remote connections, Redundant to see all your redundant connections, or Service Token to see the connections created with a service token.
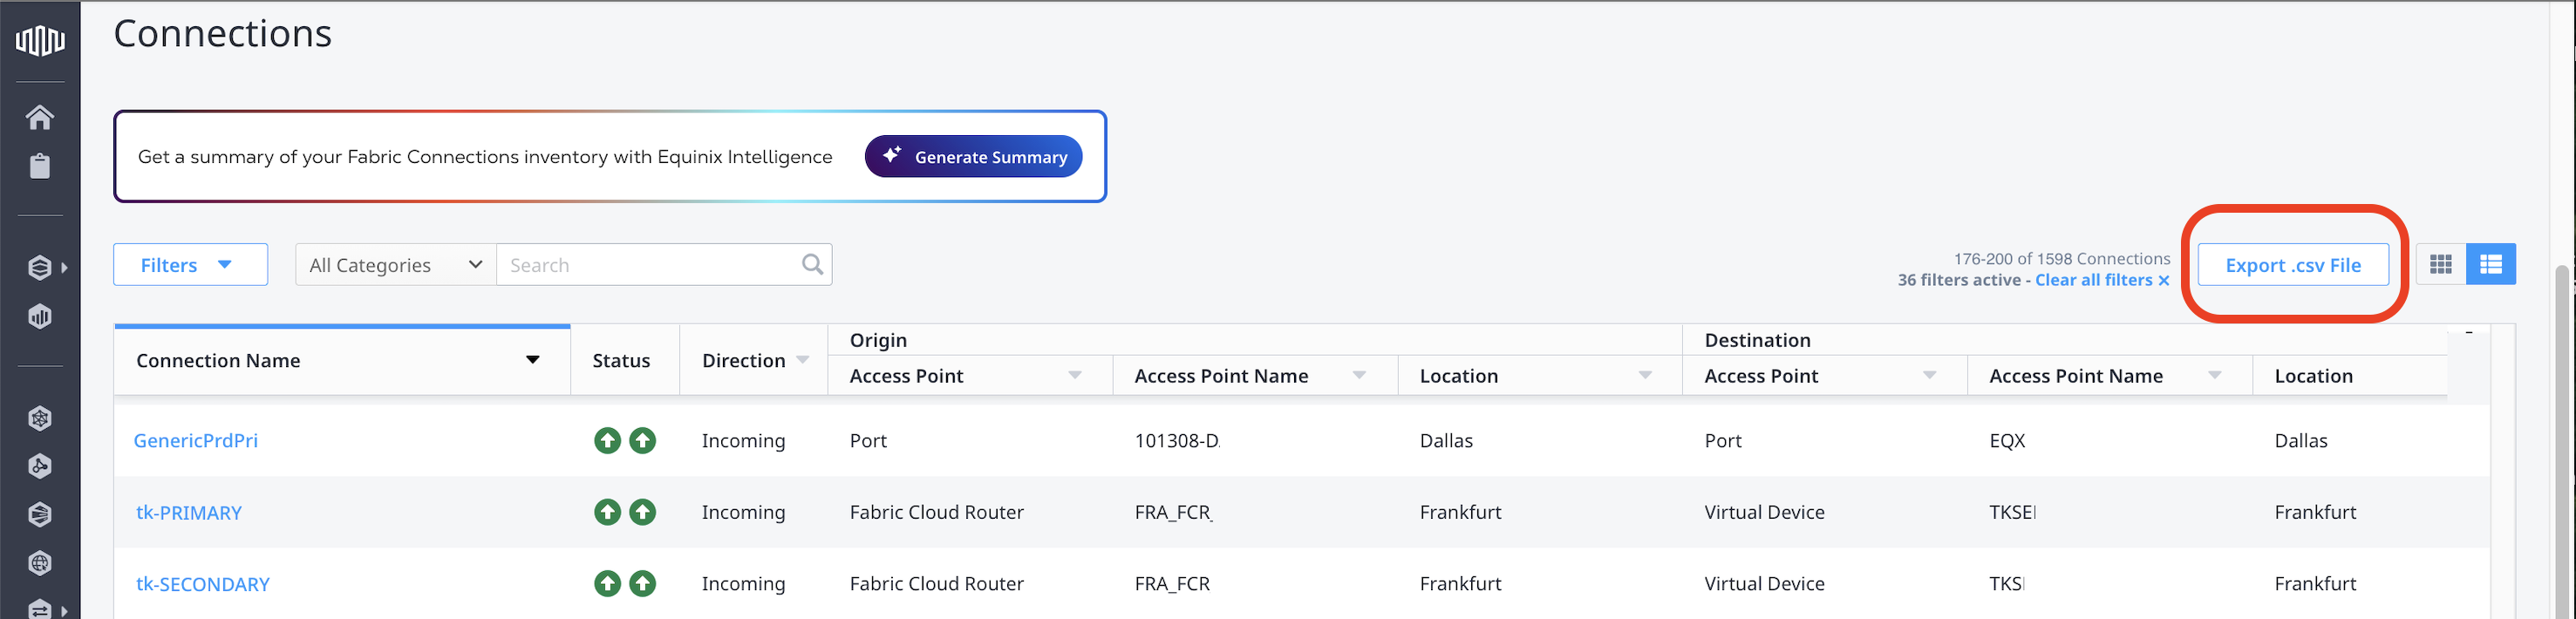
Export Connection Details
Click Export .csv file to download a spreadsheet containing all of the details for all of your connections.
Connection Status
The Status column of the Connections table displays the connection status. Hover over the status icons to see the status details.
Possible statuses are:
Equinix Status
An Error Occurred
Approved
Cancelled
Created
Deleted
Deleted API
Deprovision in Progress
Deprovisioned
Deprovisioning
Draft
Failed
Modified
Not Deprovisioned
Not Provisioned
Ordering
Pending Approval
Pending Auto Provisioning
Pending BGP
Pending Bandwidth Approval
Pending Deletion
Pending Deprovisioning
Pending Interface Configuration
Pending Provider VLAN
Pending Provider VLAN Error
Provision in Progress
Provisioned
Provisioning
Rejected
Rejection Acknowledged
Reprovision in Progress
Update Pending
Provider Status
An Error Occurred
Available
Deleted
Deleting
Deprovisioned
Deprovisioning
Error
Failed
Not Available
Not Provisioned
Ordering
Out of Bandwidth
Pending Approval
Pending BGP
Pending Configuration
Pending Deletion
Provisioned
Provisioning
Rejected
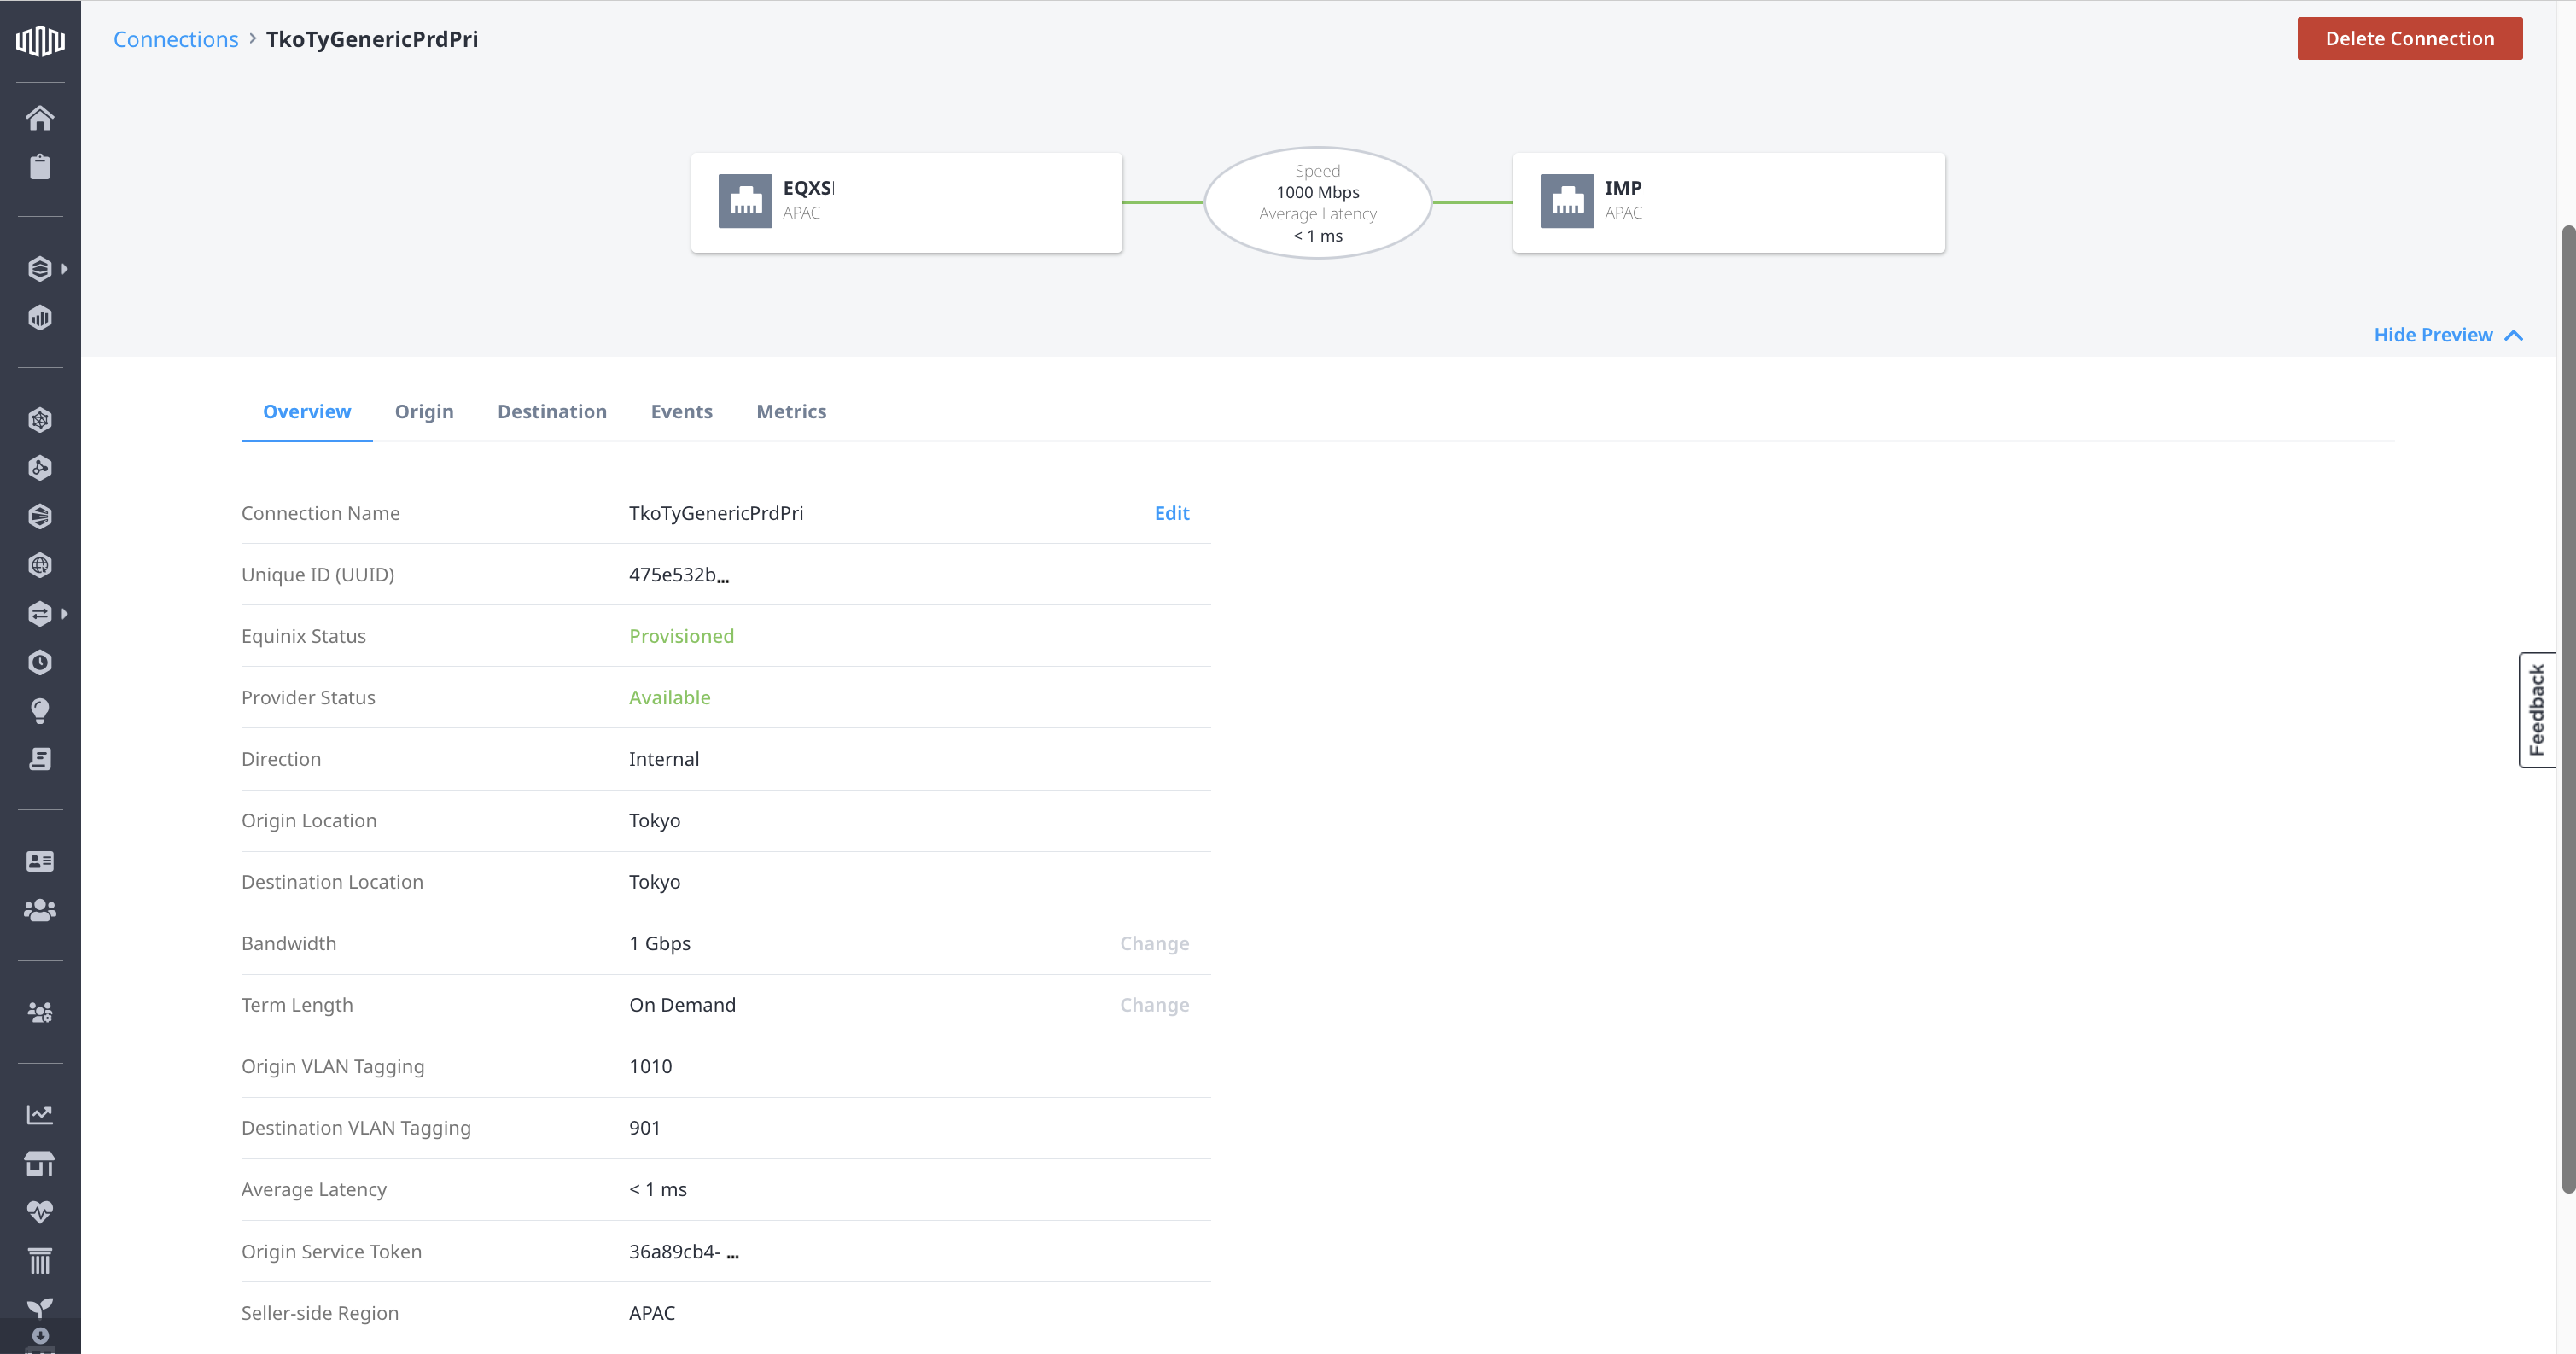
Connection Details
Click on a connection in your Connections Inventory for an Overview of the connection details.
The Order Details section provides the Billing Tier and Total Monthly Charge information for the connection.
The Activity Log section lists the creation date and the date the router was last modified. Additional event information is available on the Events tab.
The Notifications section lists the users who are notification contacts for this Fabric Cloud Router.
The Details page also contains information on:
- Origin - Provides information about the Origin of the connection, such as the Port, Fabric Cloud Router, or virtual device.
- Destination – Provides information about your connection destination, such as the Port, service provider, other Equinix service, or virtual device.
- Events - The Events tab shows connection lifecycle events for any status change to a connection, including provisioning, deprovisioning, and failures, when available. More information is on the Monitoring Connection Utilization page.
- Metrics - The Metrics tab shows connection metrics such as packet errors and bandwidth usage, when available. More information is on the Monitoring Connection Utilization page.
Submit a Support Ticket
Submit a support ticket by clicking the support icon at the bottom of the page and selecting Submit Support Ticket.