Monitoring Connection Utilization
Monitor your connection utilization and ensure sufficient bandwidth for your customers. Adjust your port usage as needed to improve performance.
To view connection utilization statistics:
-
Log in to the Customer Portal > Fabric Dashboard.
-
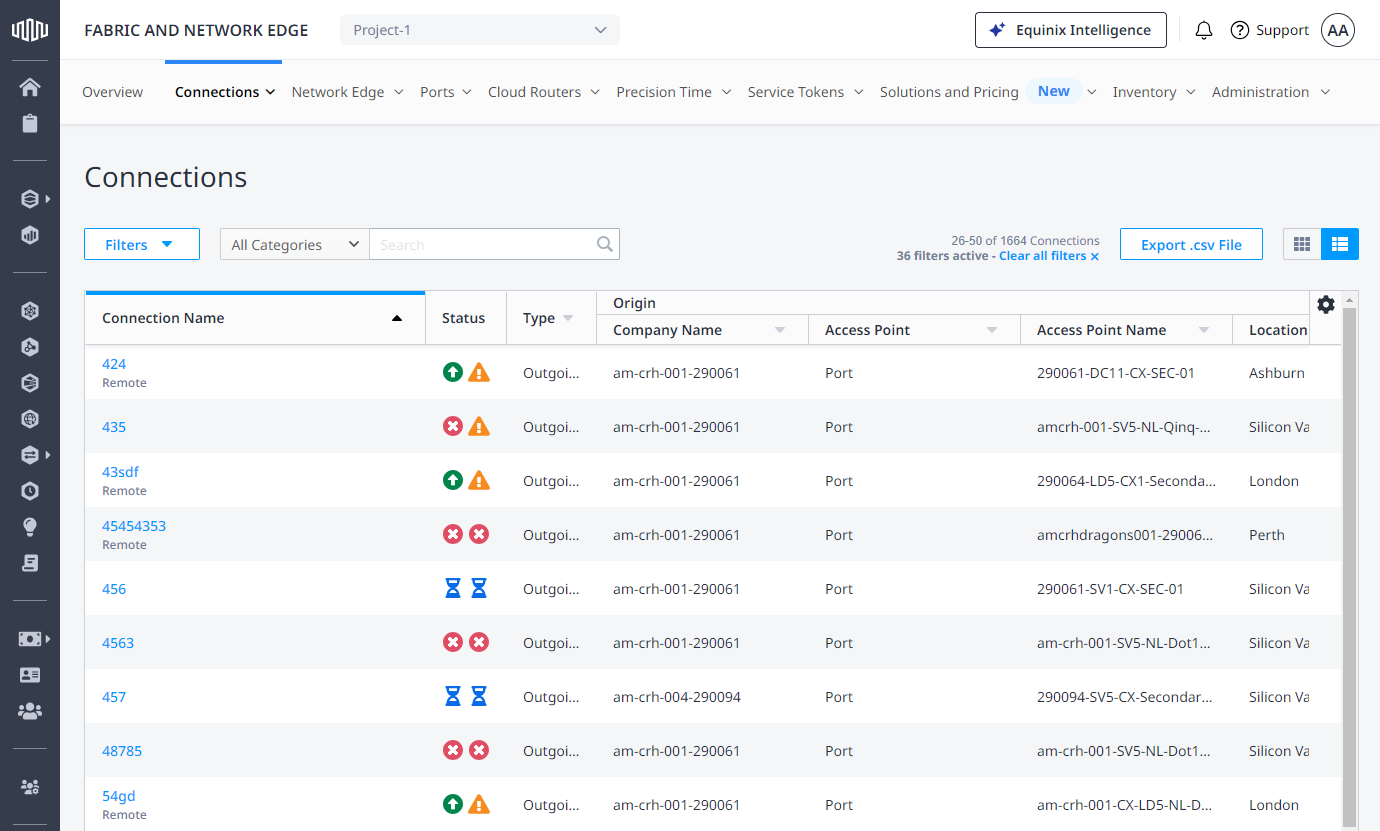
From the Connections menu, select Connections Inventory.
-
Locate and click the connection you want to monitor.
-
Click the connection to bring up the Connection Details.
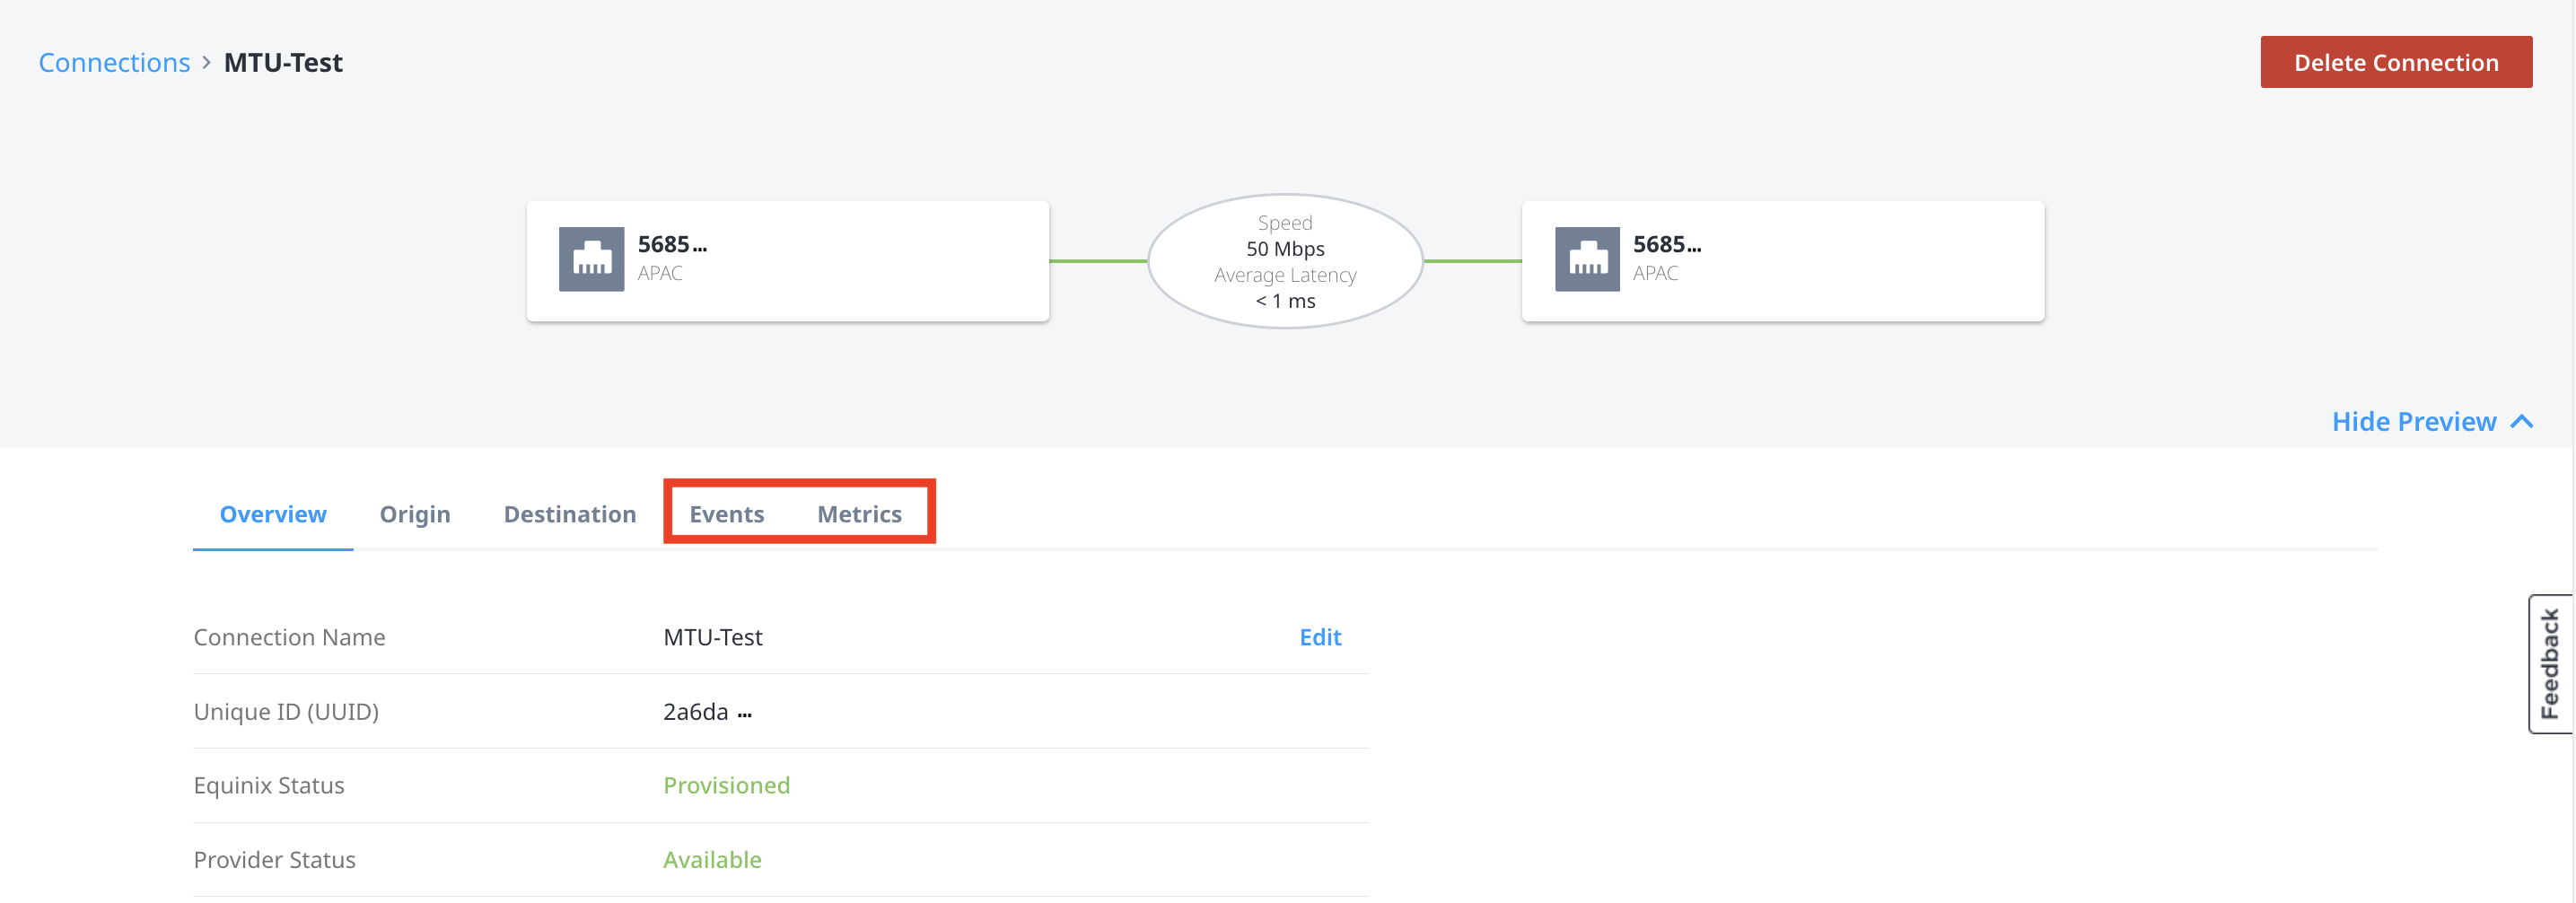
Metrics
The Metrics tab shows bandwidth and dropped packet data. Metrics are supported on connections where:
- the a-side of the connection is a port (except for e-tree networks and virtual devices).
- the connection is between a Fabric Cloud Router and a port.
- the connection is between a Fabric Cloud Router and a Cloud Service Provider.
The Usage graph shows inbound and outbound bandwidth.

The Packet Drop graph shows the inbound and outbound packets dropped for the a-side and z-side of the connection. If only one side of the connection is a port, packet drop metrics are only available for the port side.
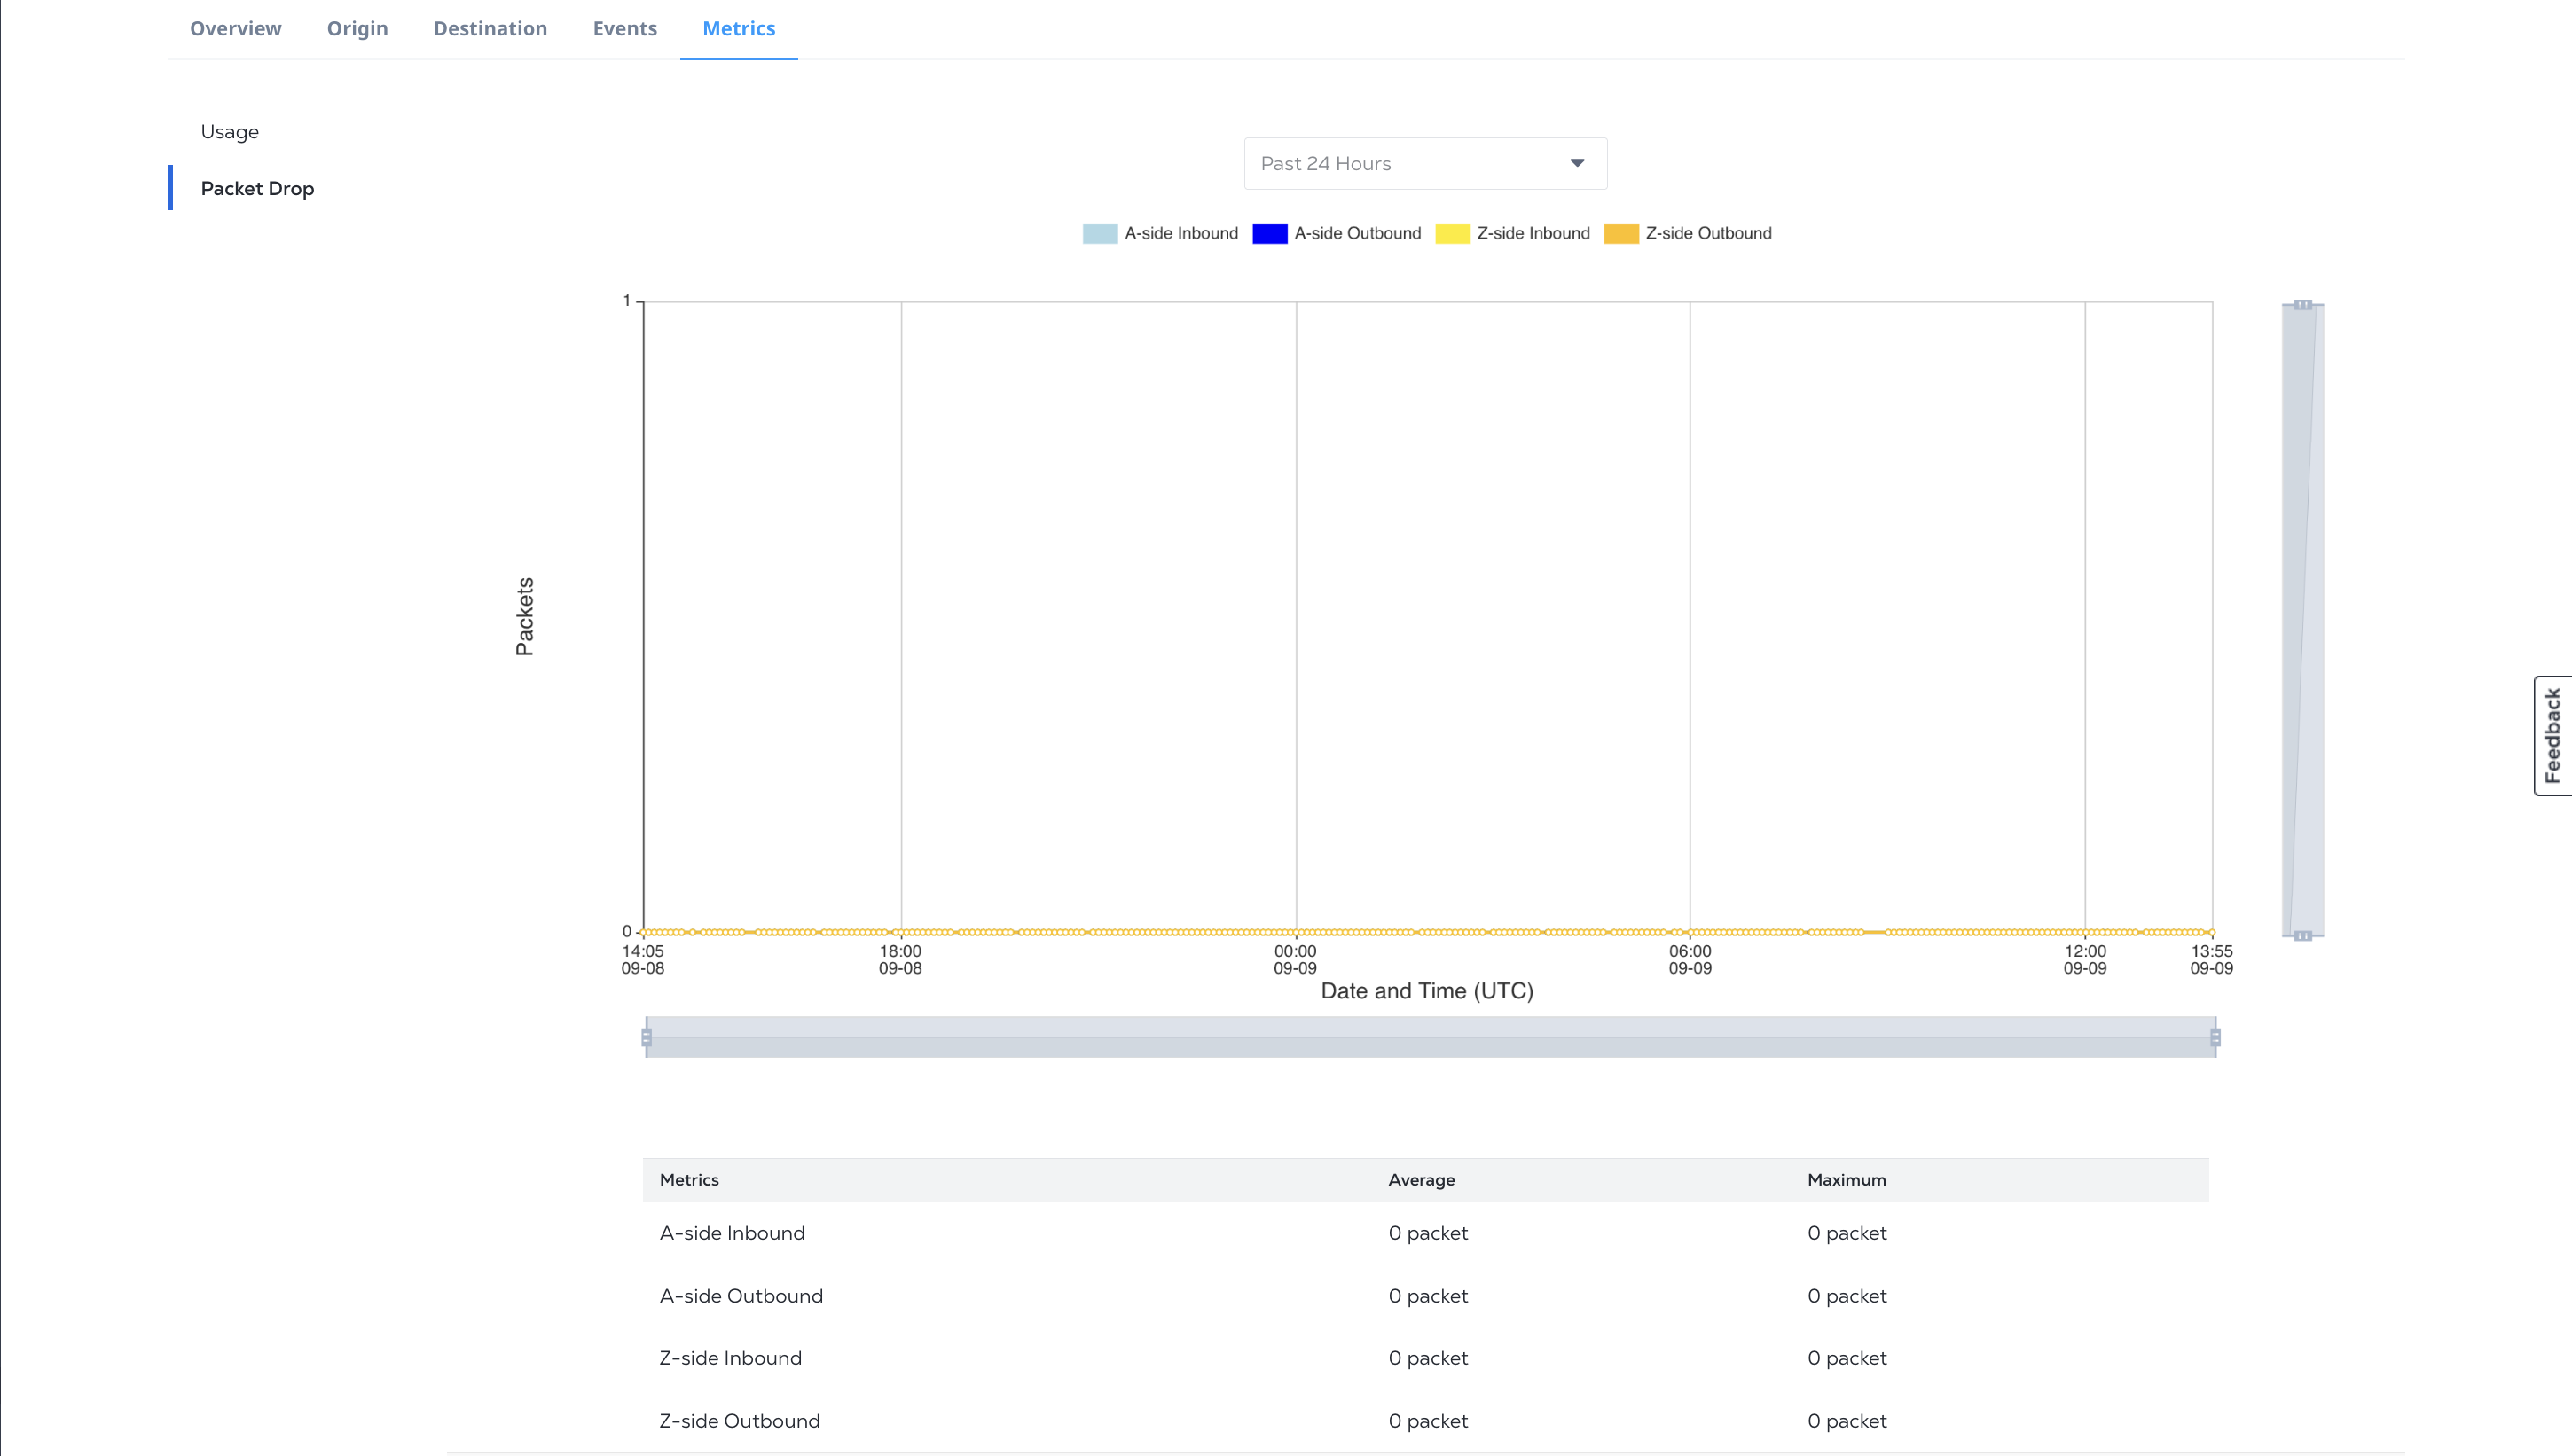
From the Time Period drop-down list, select a predefined setting or choose Custom Date Range to define your own time interval.
Use the sliders at the bottom and to the right of the graph, to change the scale. Hover over the graph to see traffic readings in a specific timestamp.
Metric Alert Rules
Set alerts when a connection's bandwidth or the number of packets dropped exceeds a certain threshold.
For instructions on configuring connection bandwidth and packet threshold alerts, and how to receive those alerts, see Managing Metric Alert Rules.
Events
The Events tab shows connection lifecycle events for any status change to a connection, including provisioning, deprovisioning, and failures, when available. Not all connections support events.
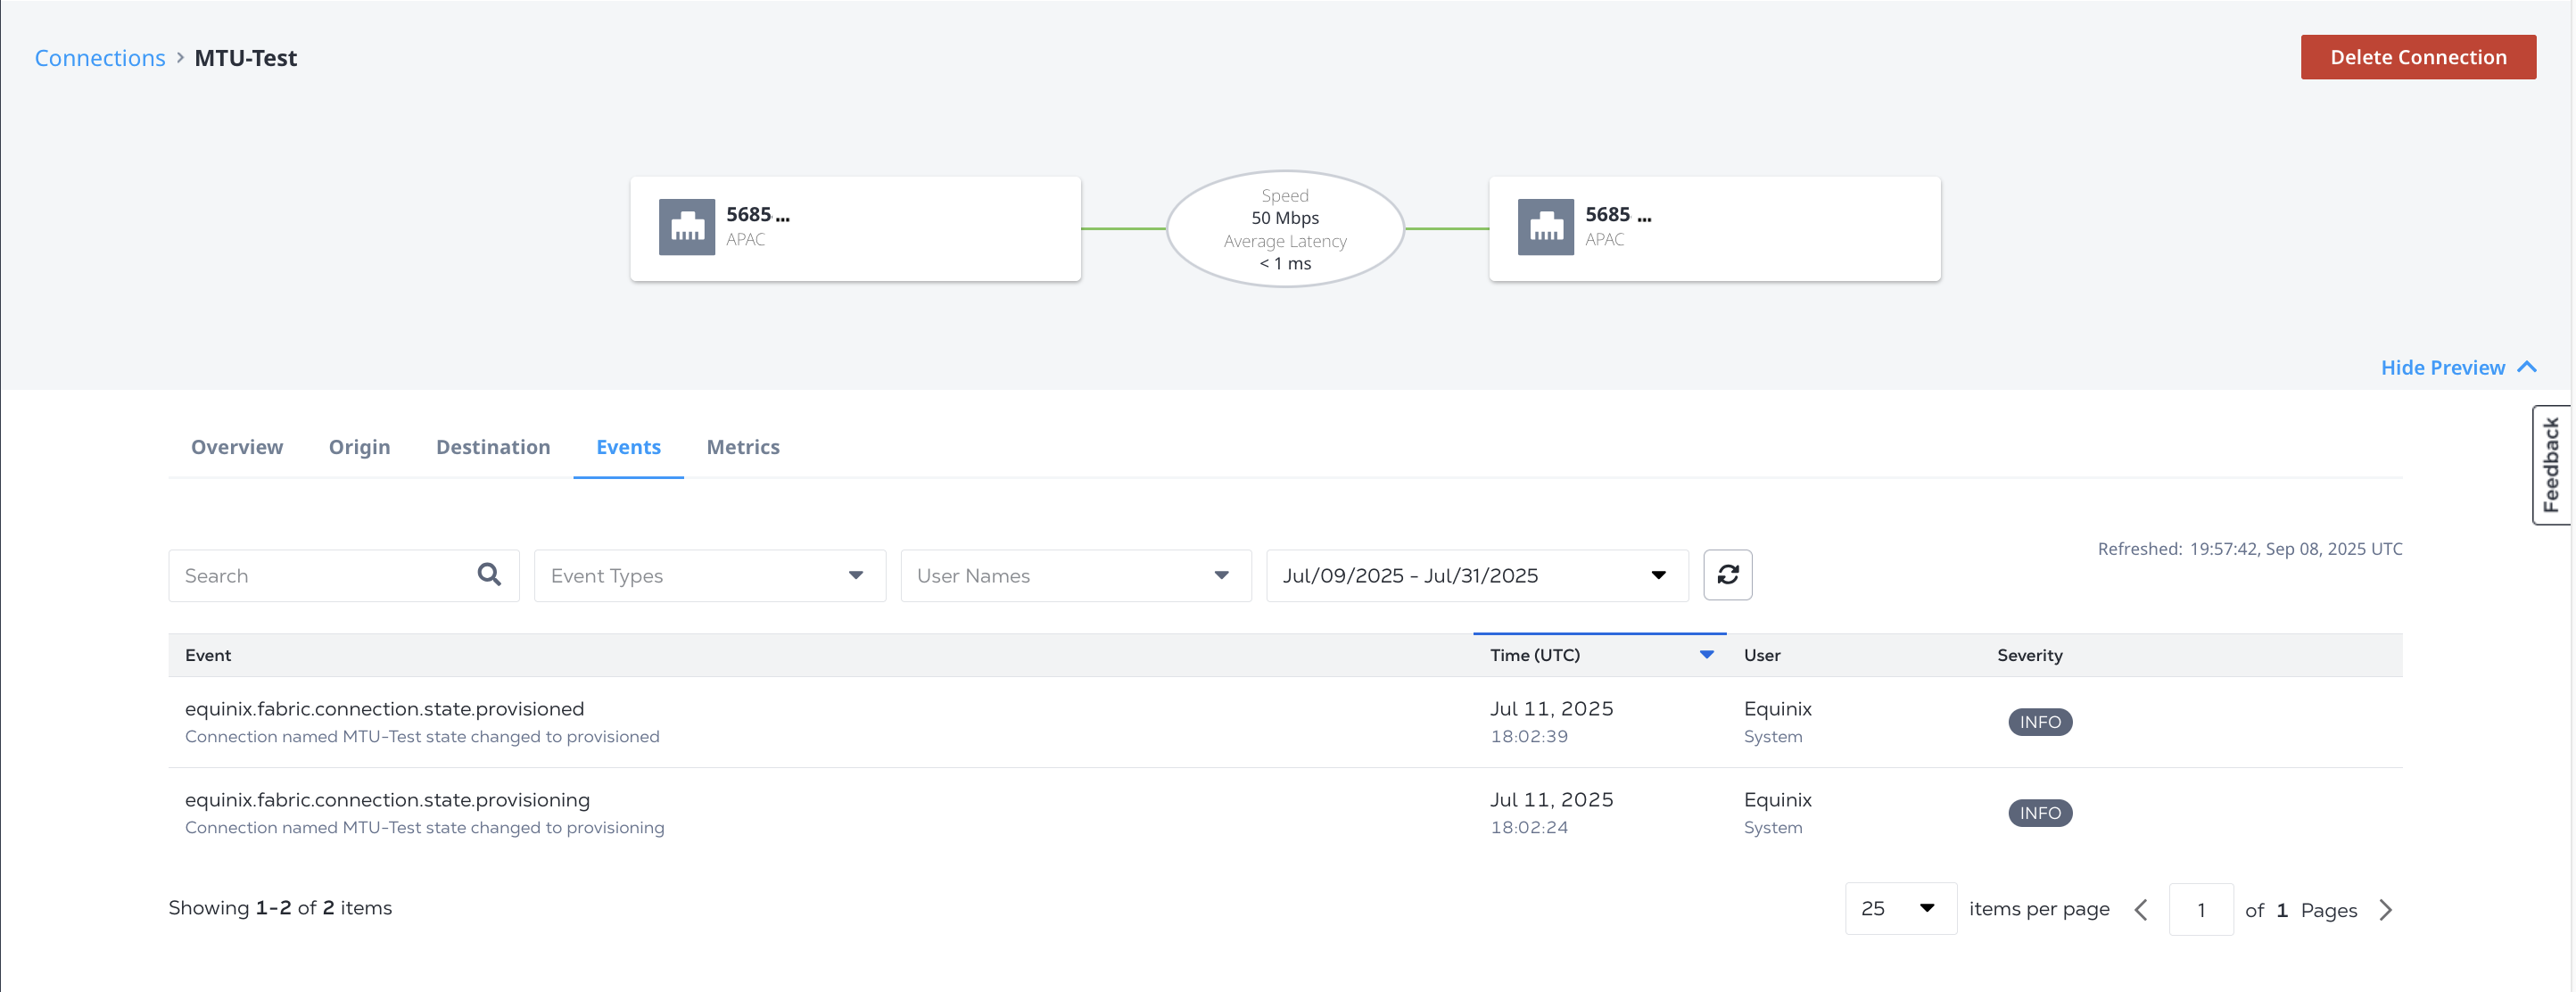
Filter the table by event type, user name. From the Time Period drop-down list, select a predefined setting or choose Custom Date Range to define your own time interval. Events are not refreshed automatically. Click refresh to update the data in the table.
Connection Monitoring in the API
The Equinix API offers the ability to create and customize a stream that collects usage data for your connection or connections. Once you have created a stream you can view the usage data from the Equinix API or create a subscription to have the data sent to your data collection platform.
To configure connection monitoring from the API:
To get your data, either:
- Retrieve the data from the Metrics API endpoint or the Events API endpoint
- Create a subscription and send the data to a data collector.