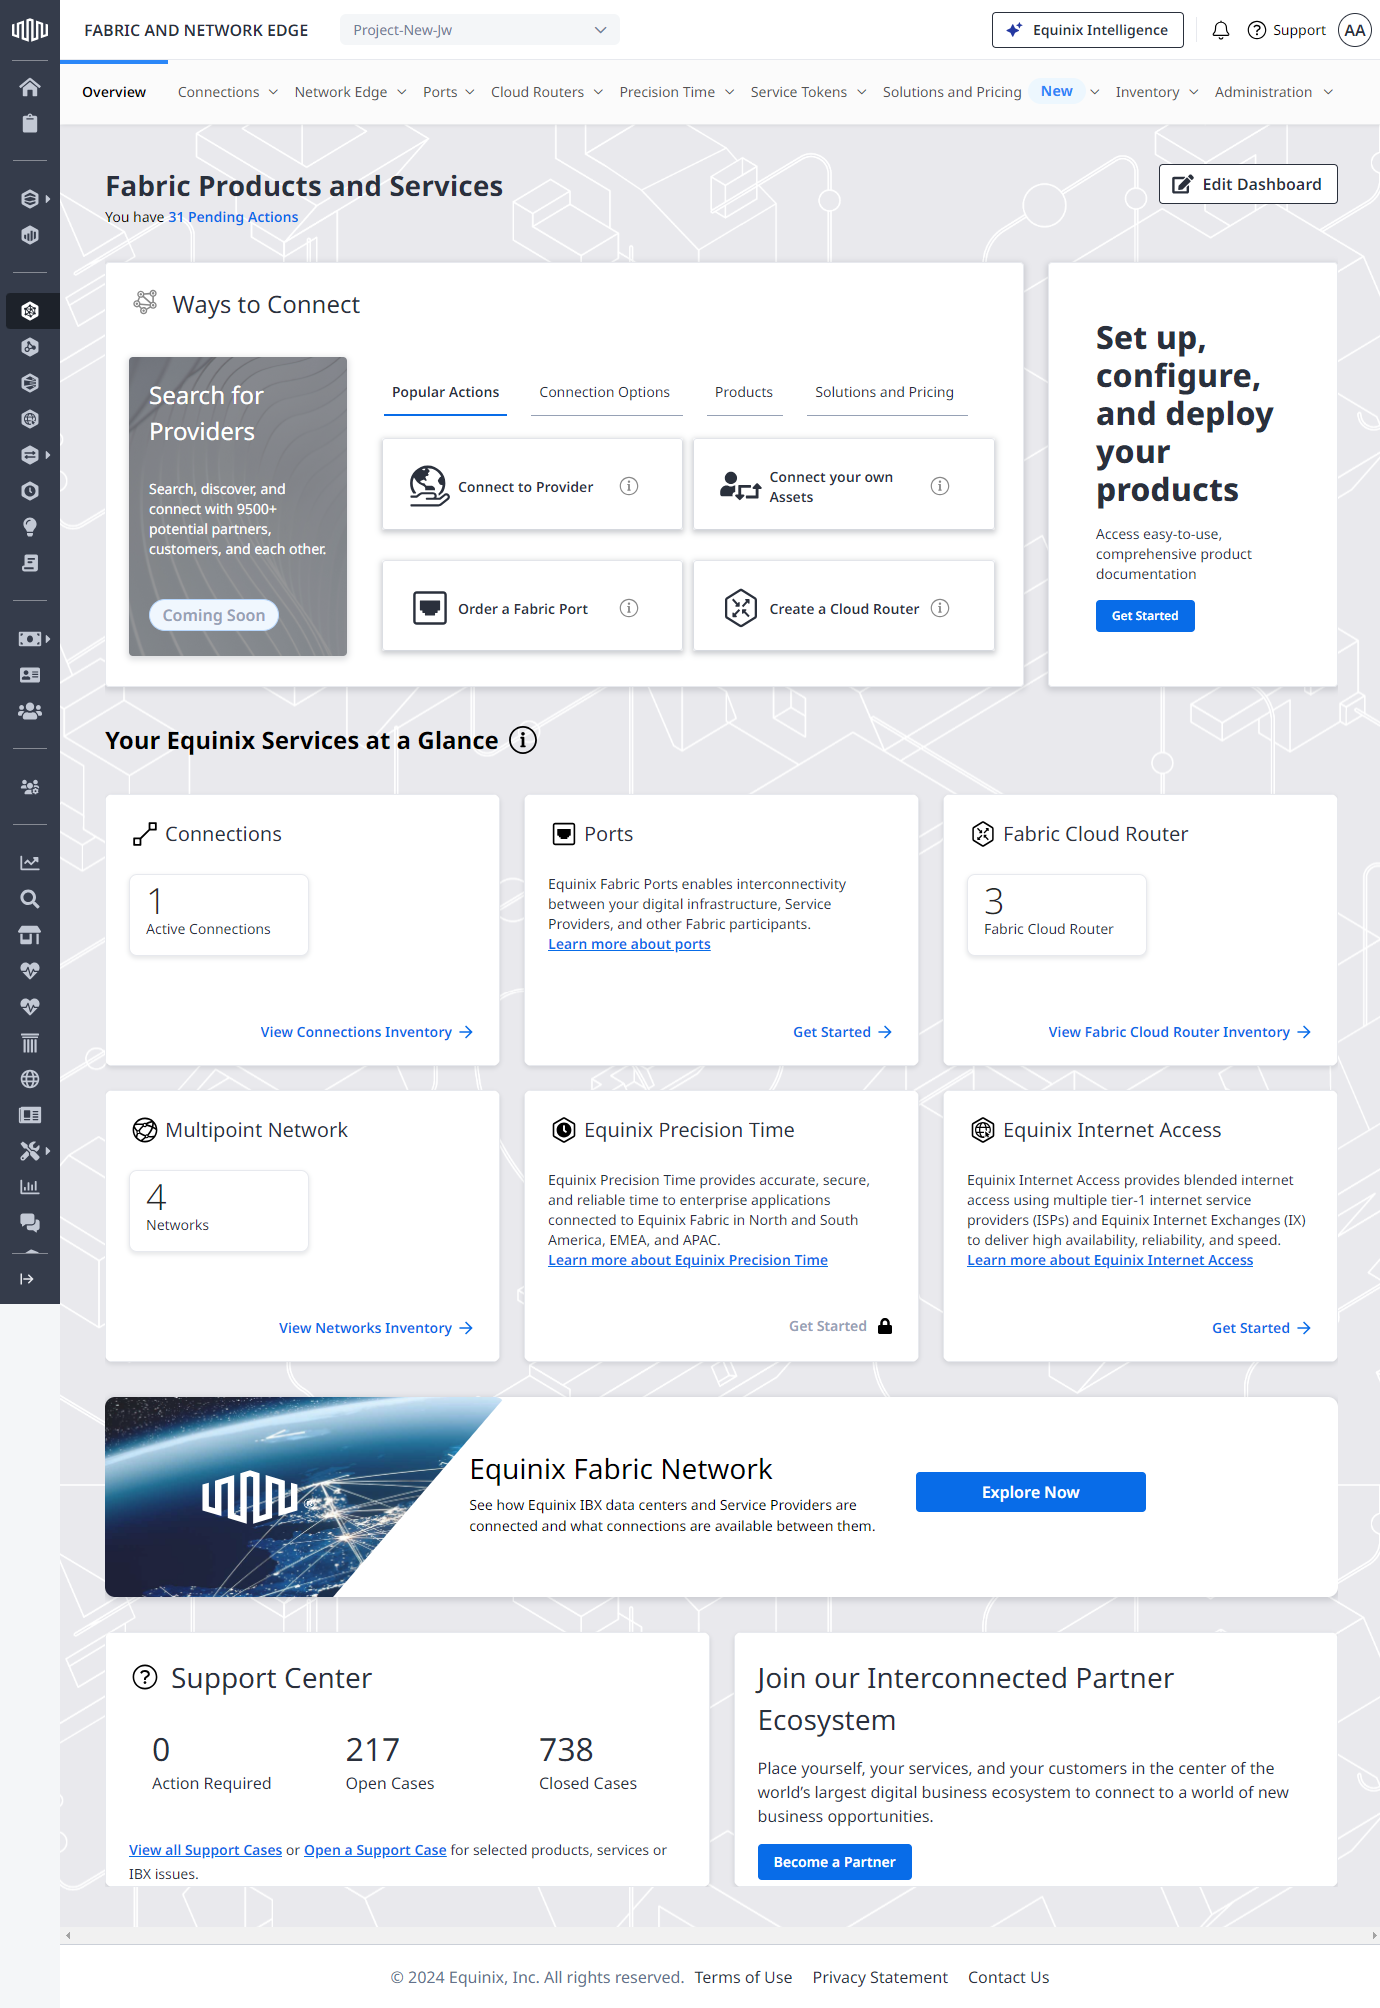
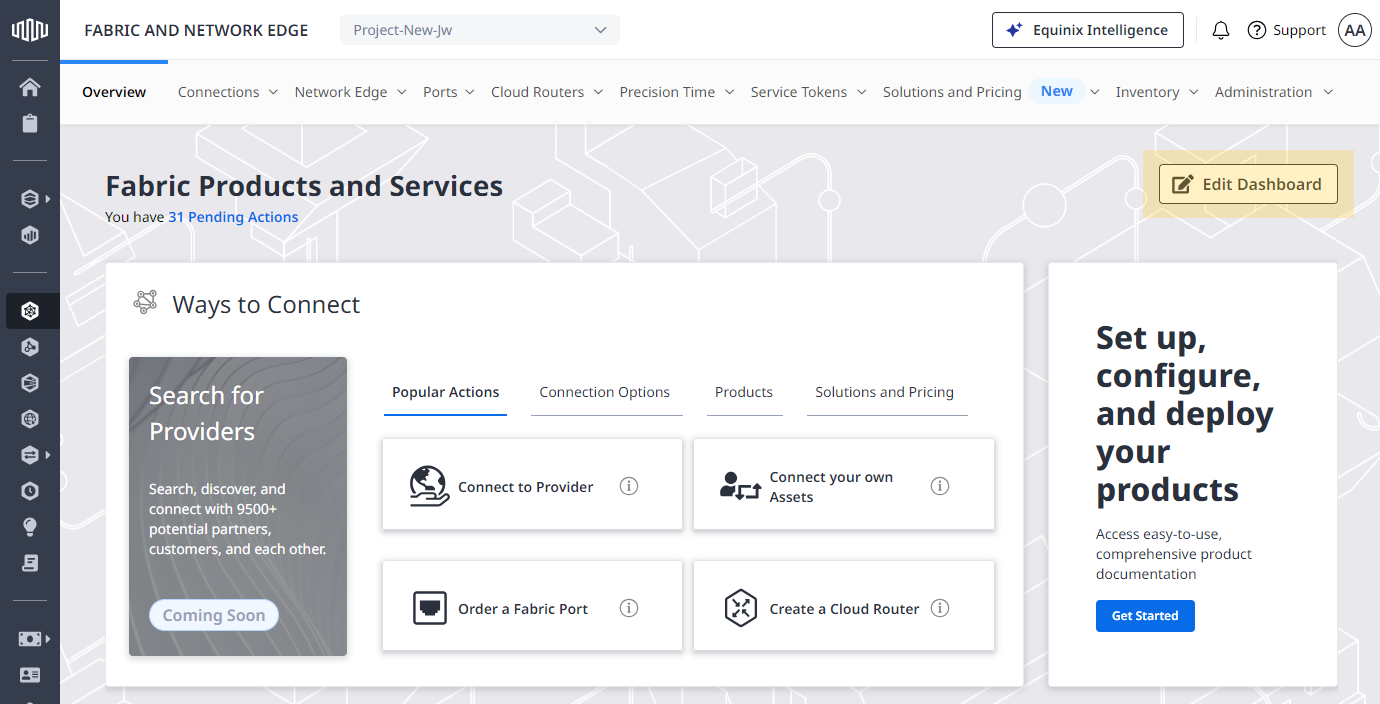
The Fabric Dashboard
The Equinix Fabric dashboard provides a clear overview of your setup and simplifies the process of initiating and managing various ordering options.
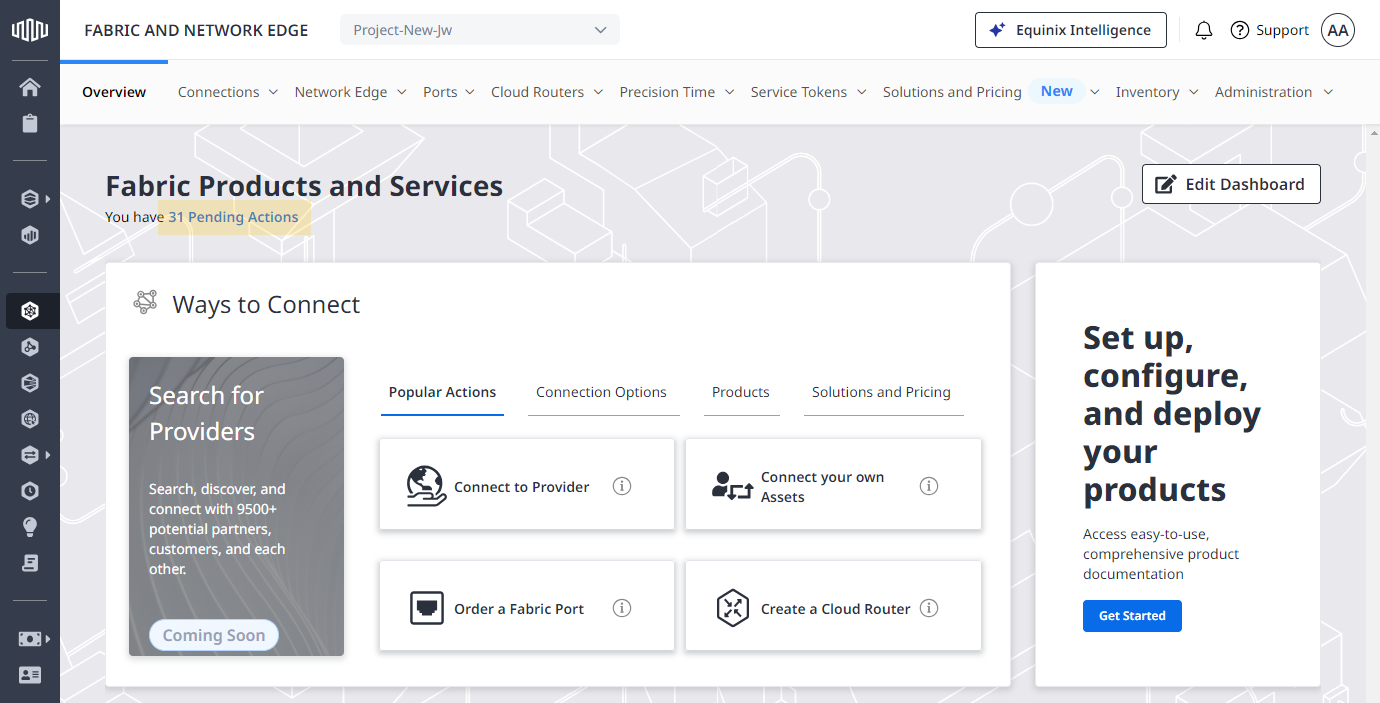
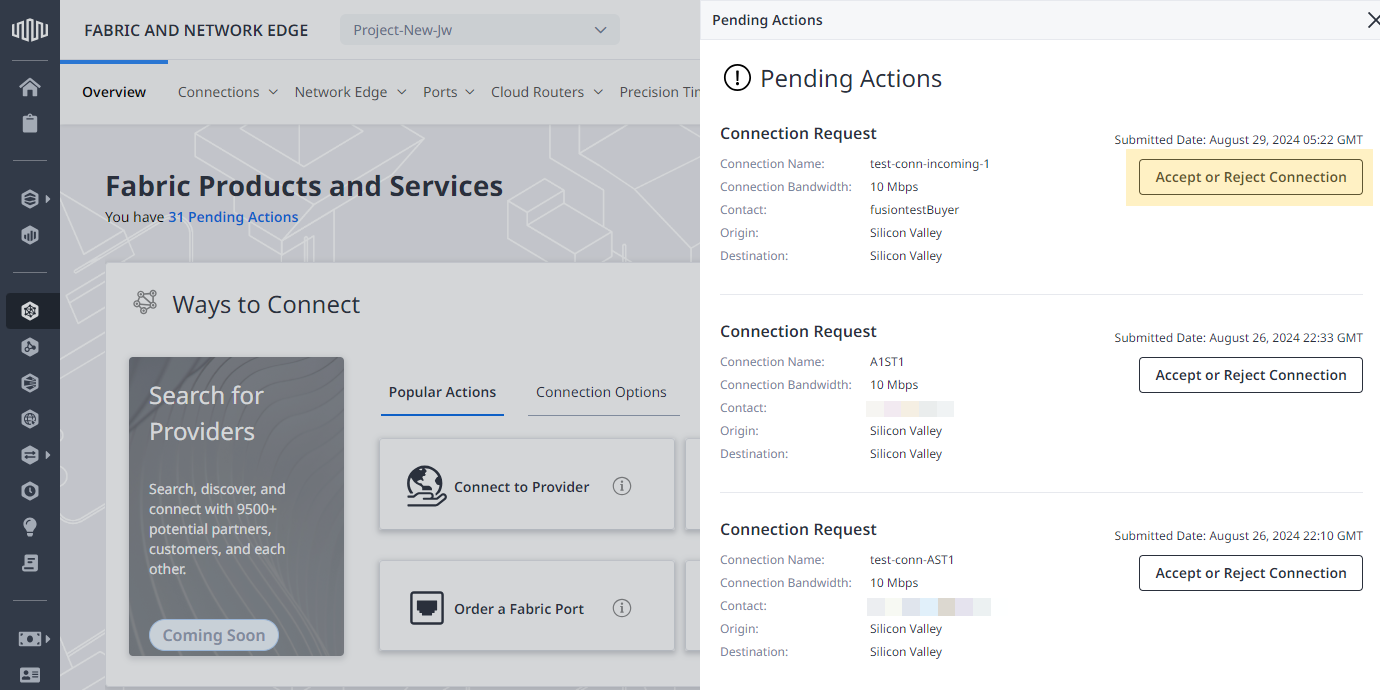
Pending Actions
Customer portal's dashboard enables quick access to pending actions.
To view and act on pending actions:
-
Log in to the Customer Portal > Fabric Dashboard.
-
Click Pending Actions directly under Fabric Products and Services.
-
Click Accept or Reject Connection to access the connection's details and manage the request to connect.
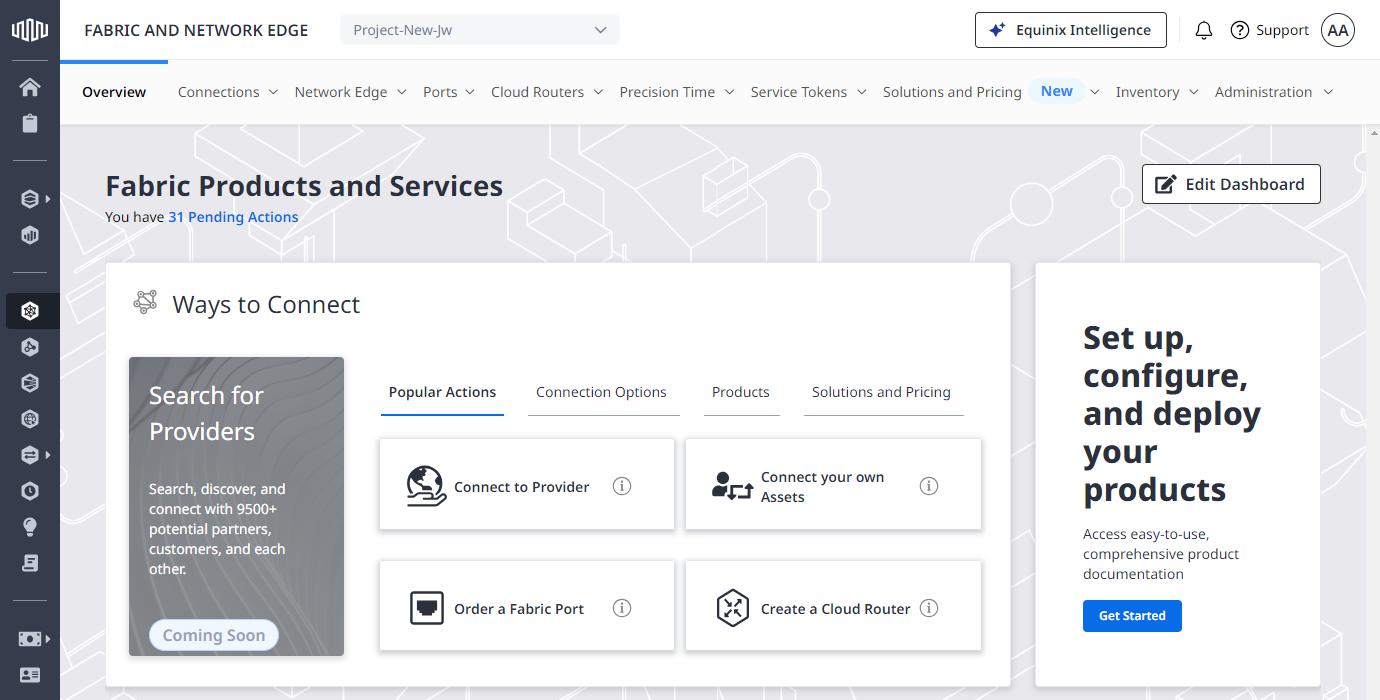
Ways to Connect
The Ways to Connect section provides quick access to the most popular actions, connection options, digital products, and pricing tools.
Your Equinix Services at a Glance
The Your Equinix Services at a Glance section provides an overview of your Equinix Fabric assets along with Equinix Precision Time and Equinix Internet Access services.
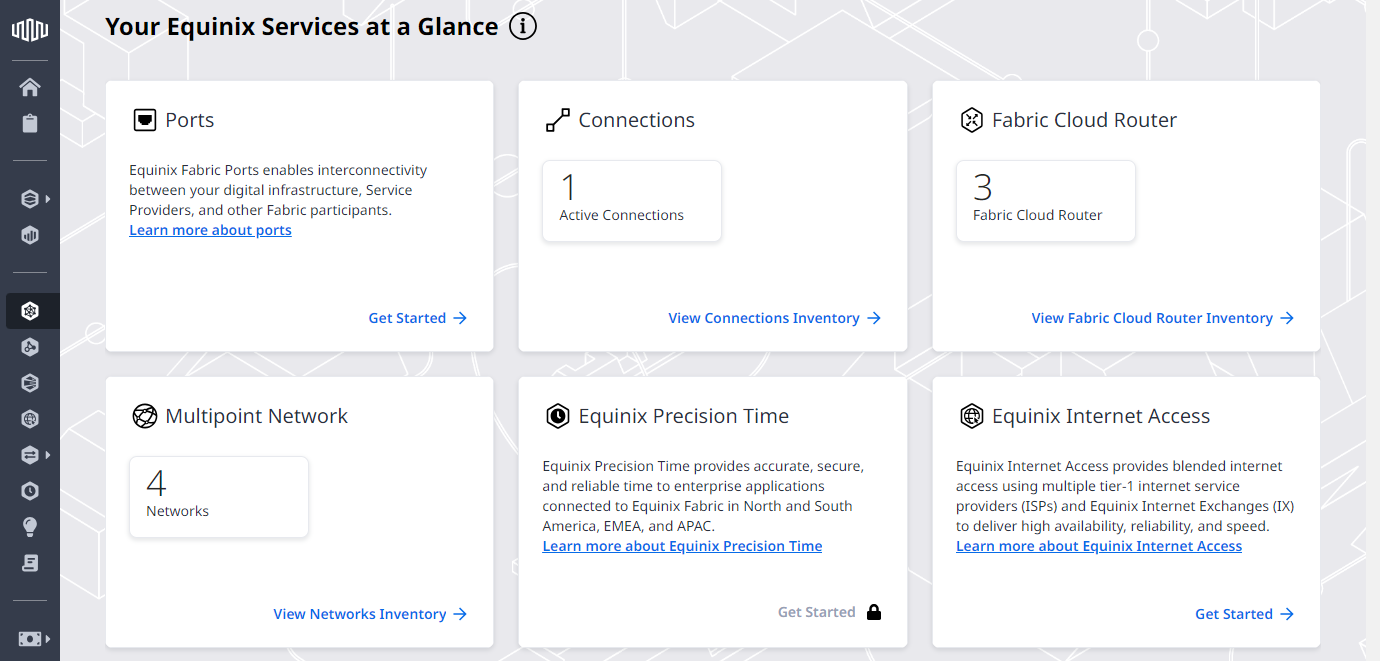
The service statistics widgets display key information for each Equinix Fabric service displayed in the portal, including:
- Fabric ports in
ACTIVEstate. - Connections in
AVAILABLEandPROVISIONEDstates. - Fabric Cloud Router instances in
PROVISIONEDstate. - Networks in
PROVISIONEDstate. - Equinix Precision Time service instances in
PROVISIONEDstate.
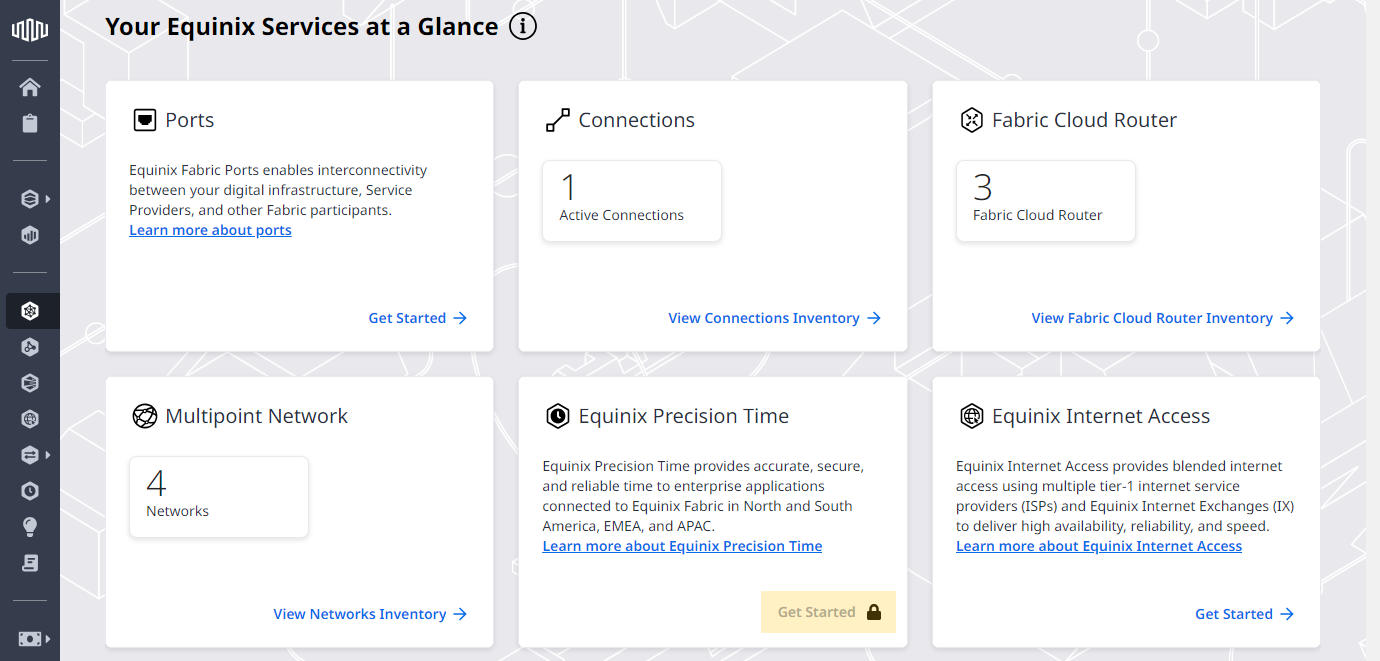
If you don't have a specific Fabric asset or an Equinix service, click Get Started to place an order.
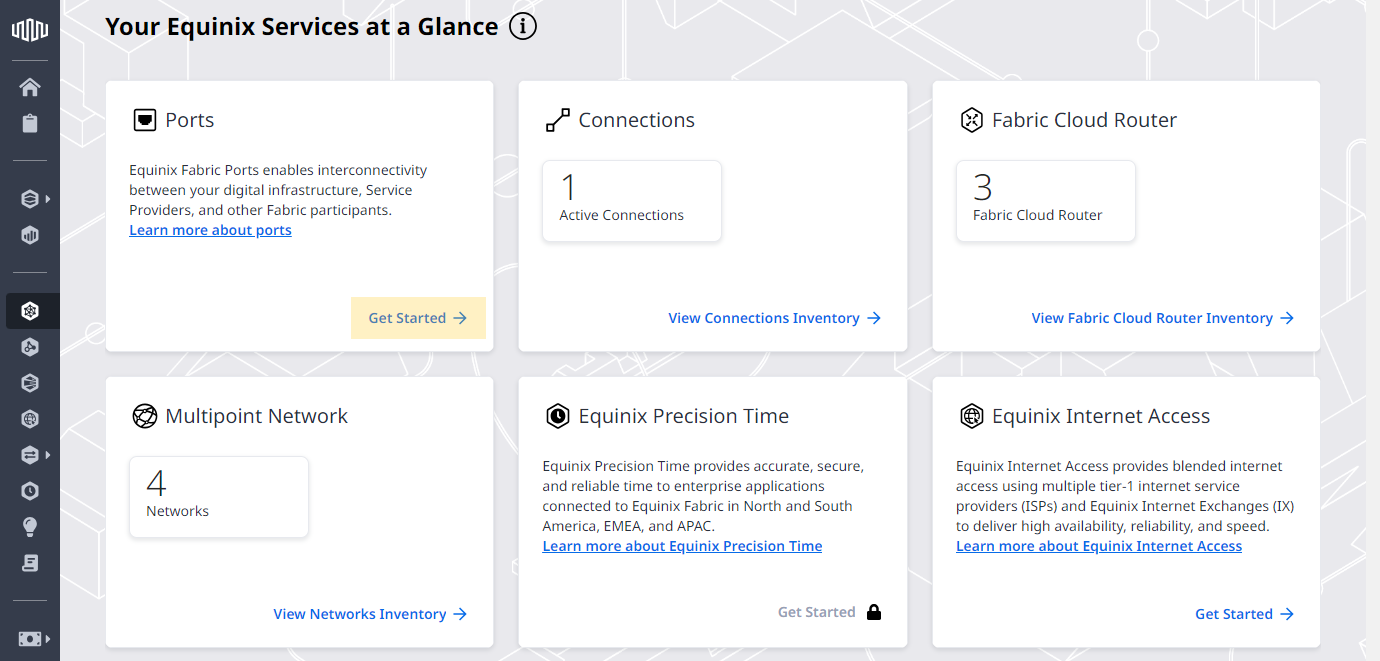
If you don't have permissions to order a specific Fabric asset or an Equinix service, contact your company administrator.
Equinix Fabric Network
The Equinix Fabric Network Map gives you the ability to:
- View Equinix Fabric global locations in either a 2D flat or 3D spherical view.
- View service providers and their on-ramps in all Equinix Fabric locations.
- Visualize how Equinix Fabric locations are connected globally to form the Equinix Fabric Global Network.
- Visualize routing between any two selected locations and get an indicative value of latency (round trip) between those locations as well as the details of any subsea cables used.
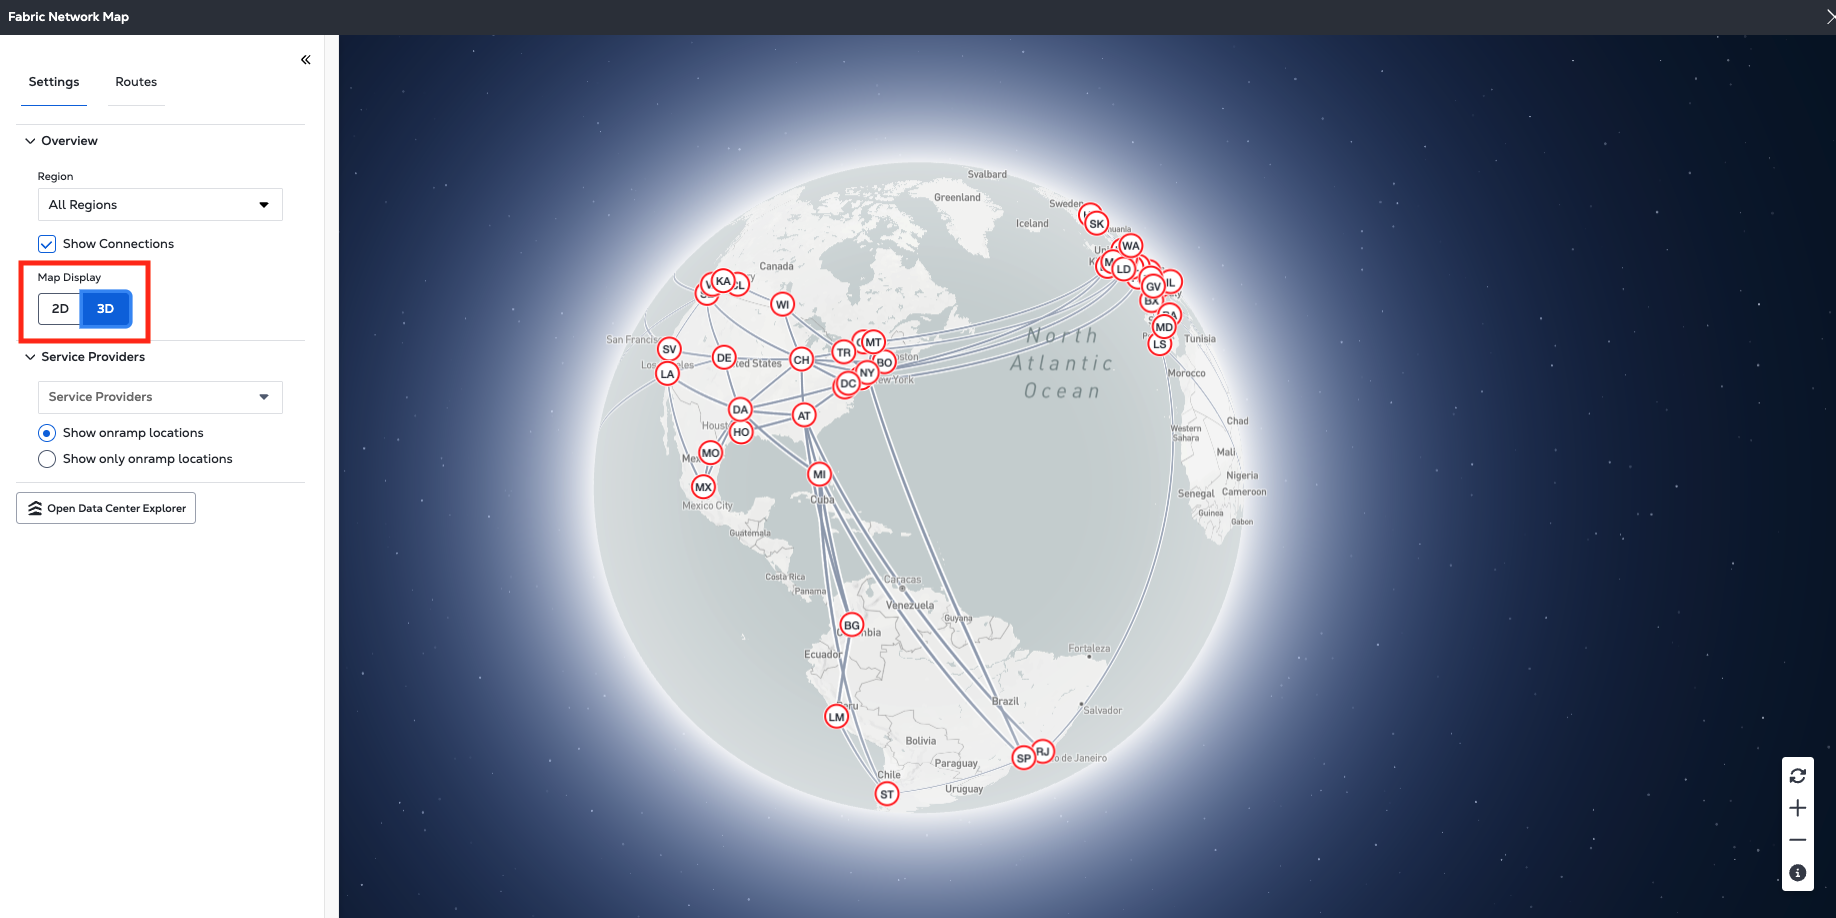
Global View
When you access the Equinix Fabric Network Map, you are initially presented with a flat view of all Equinix locations.
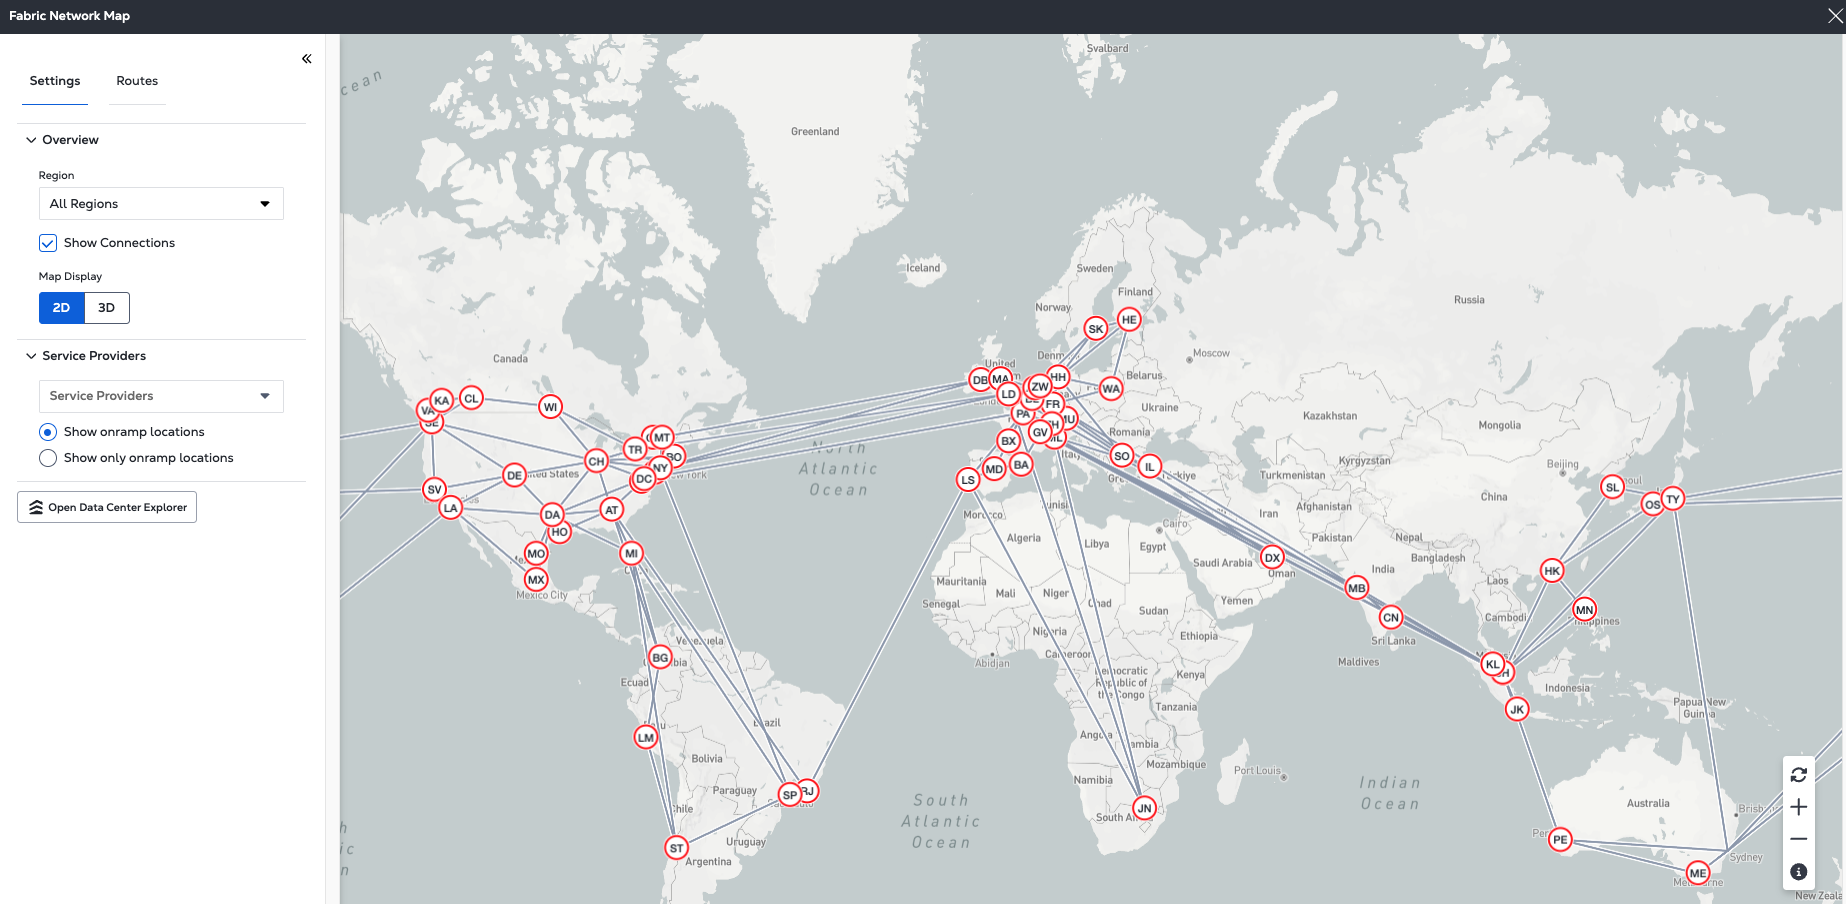
Use the Map Display feature to toggle from a 2D flat view to a 3D spherical view. Hold the left mouse button to drag the map (2D) or rotate the map (3D).
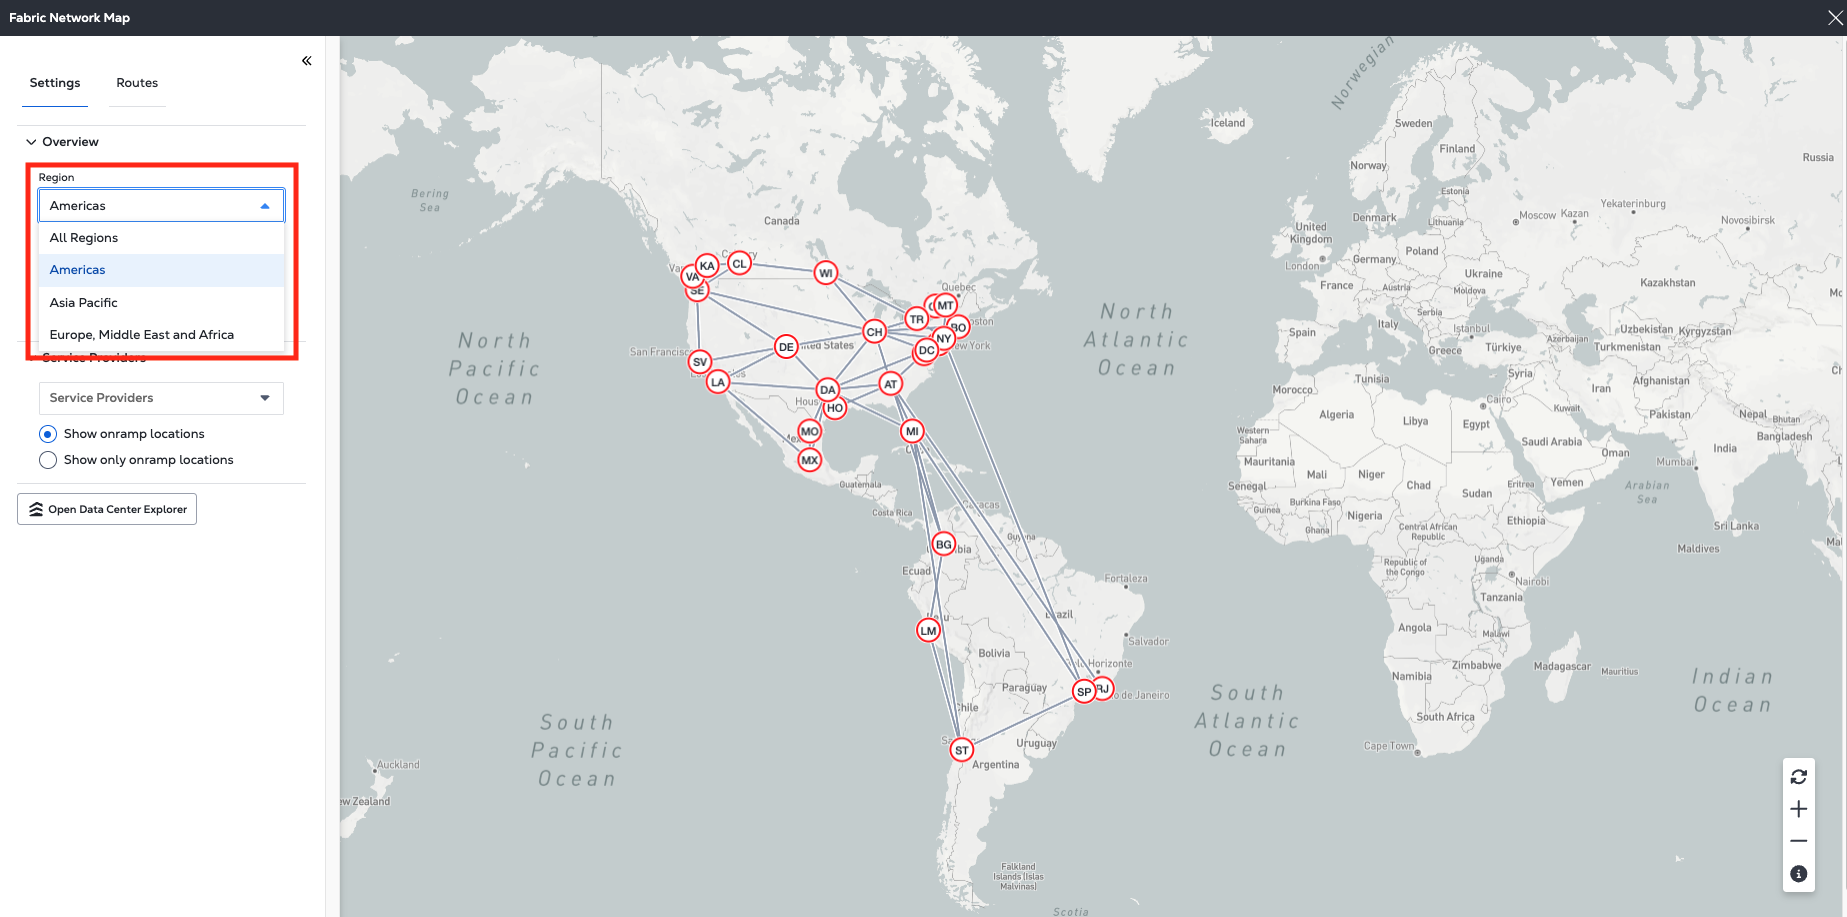
Regional View
Select an individual region to view only the locations and the Equinix Fabric network in that specific region.
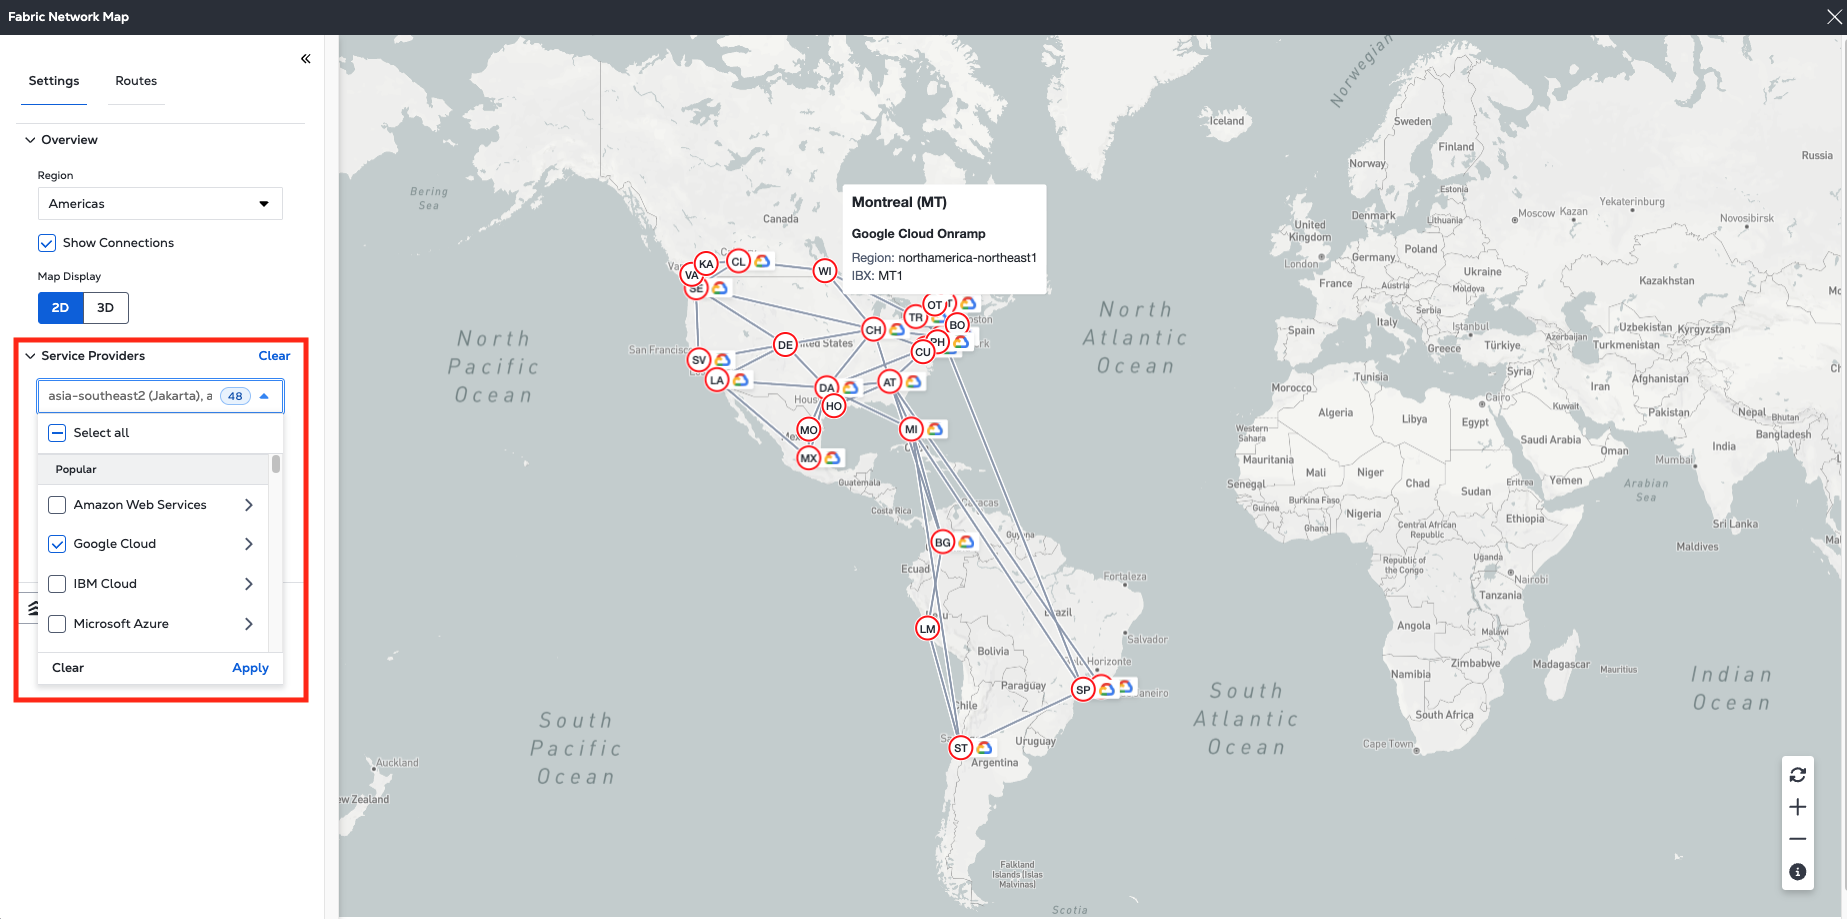
Service Providers
Use the Service Providers map feature to view the availability of any or all service providers and their onramps in each Equinix Fabric location.
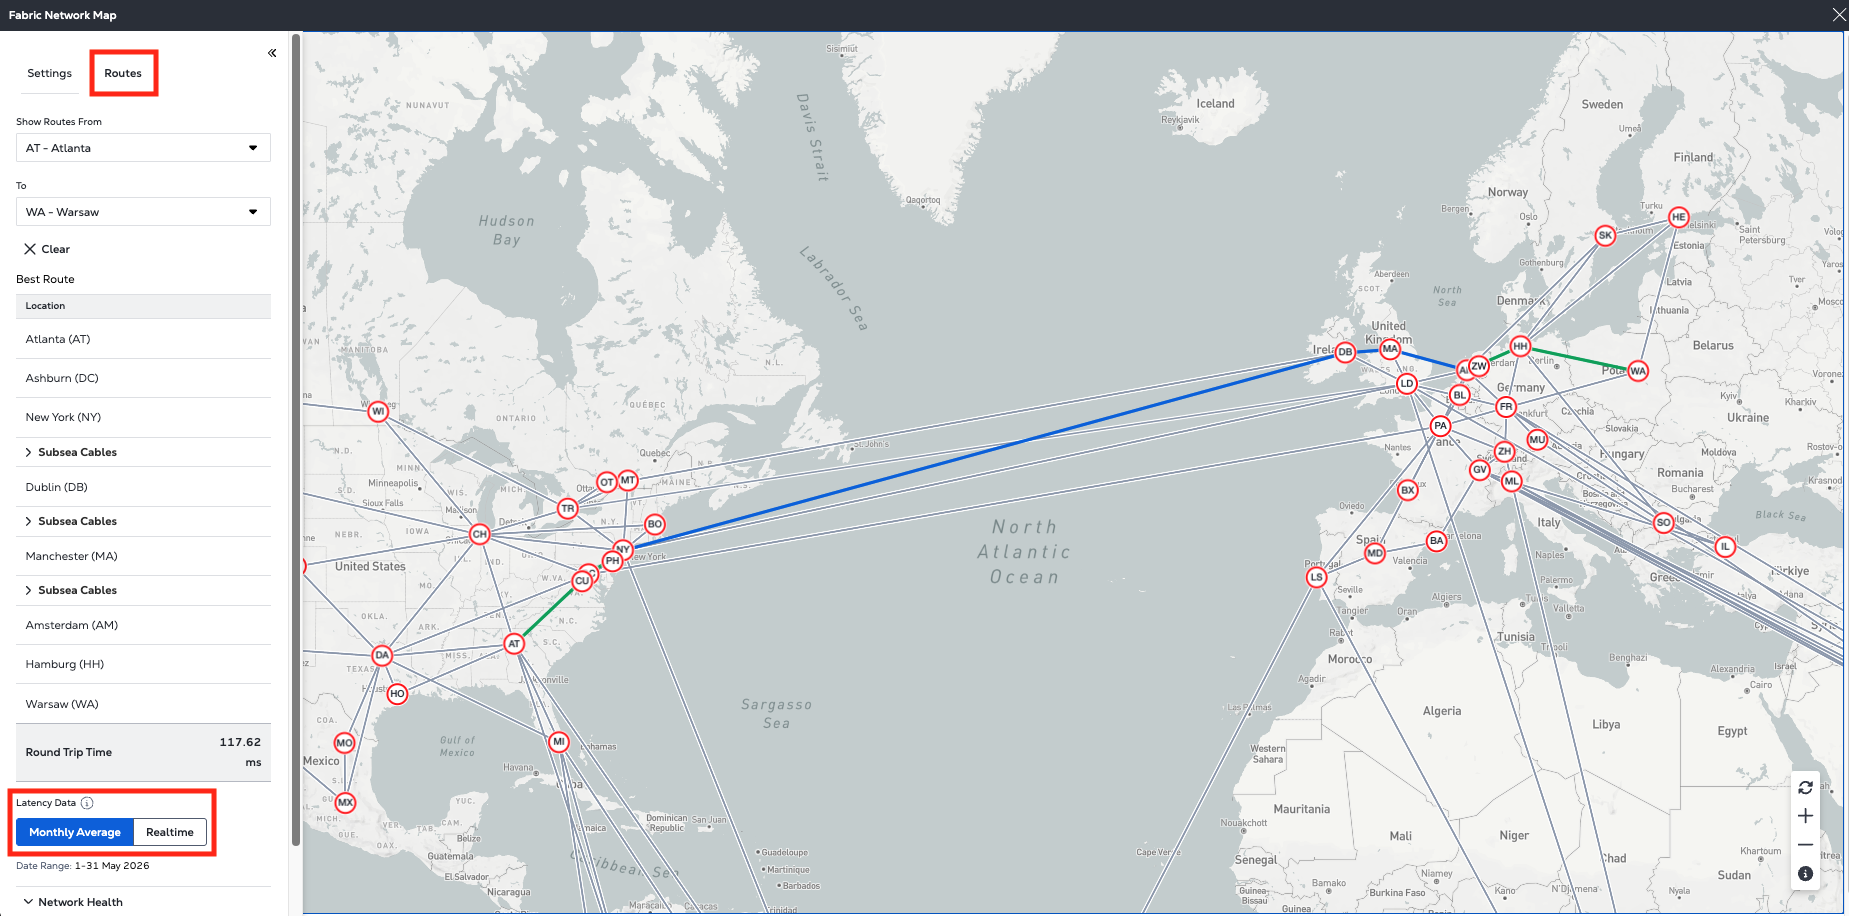
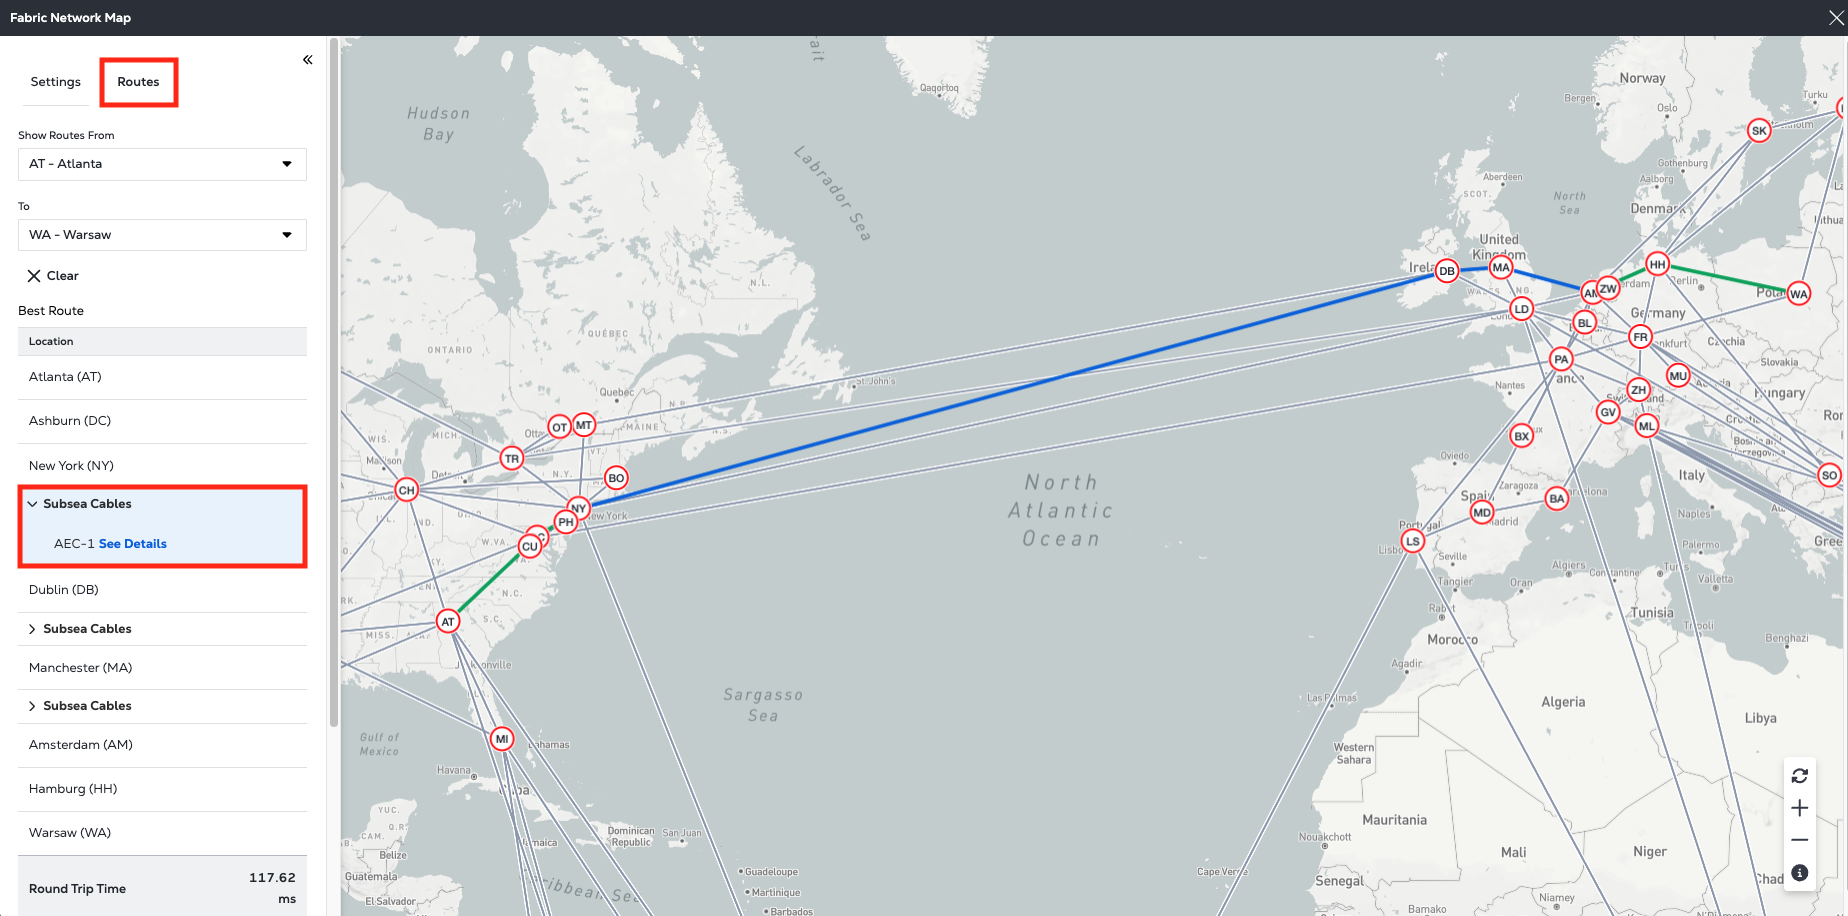
Routes
Use the Routes map feature to visualize the routing on a metro hop-by-hop basis between any two selected locations, as well as the latency (round trip time) between those two Fabric locations.
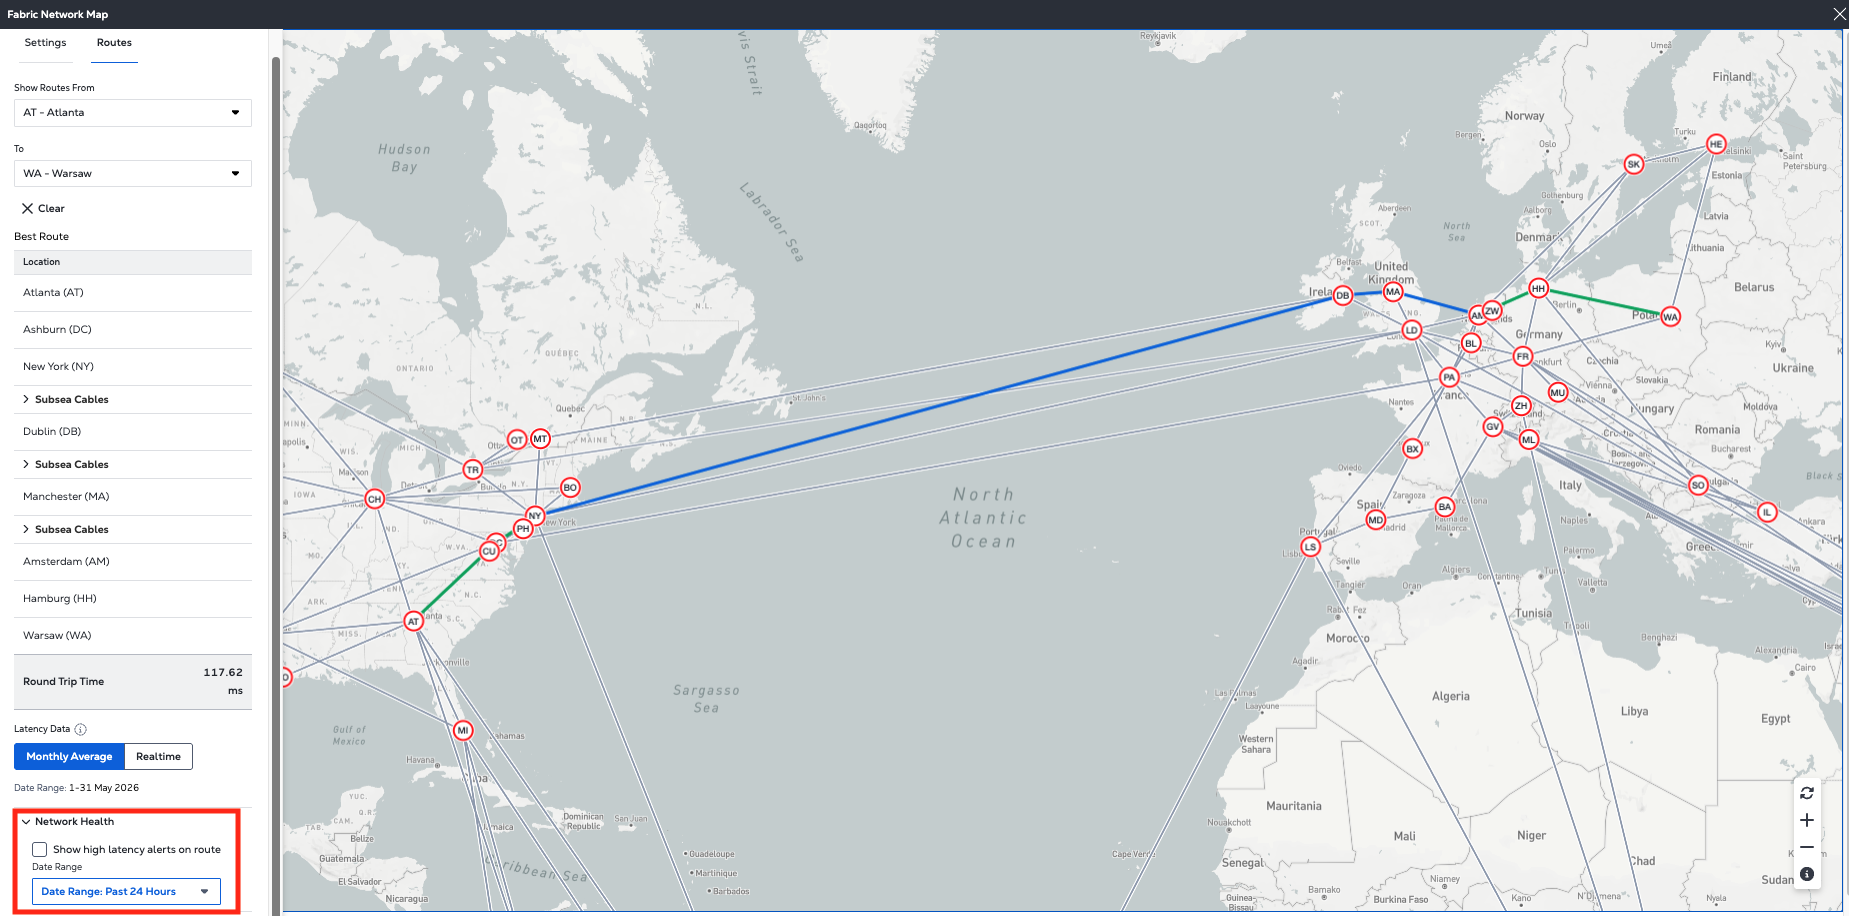
By default, the view is representative of normal operational conditions with a value of the average (preceding month) round trip time but users can also toggle to a real-time view to observe current network behavior.
Subsea cable systems
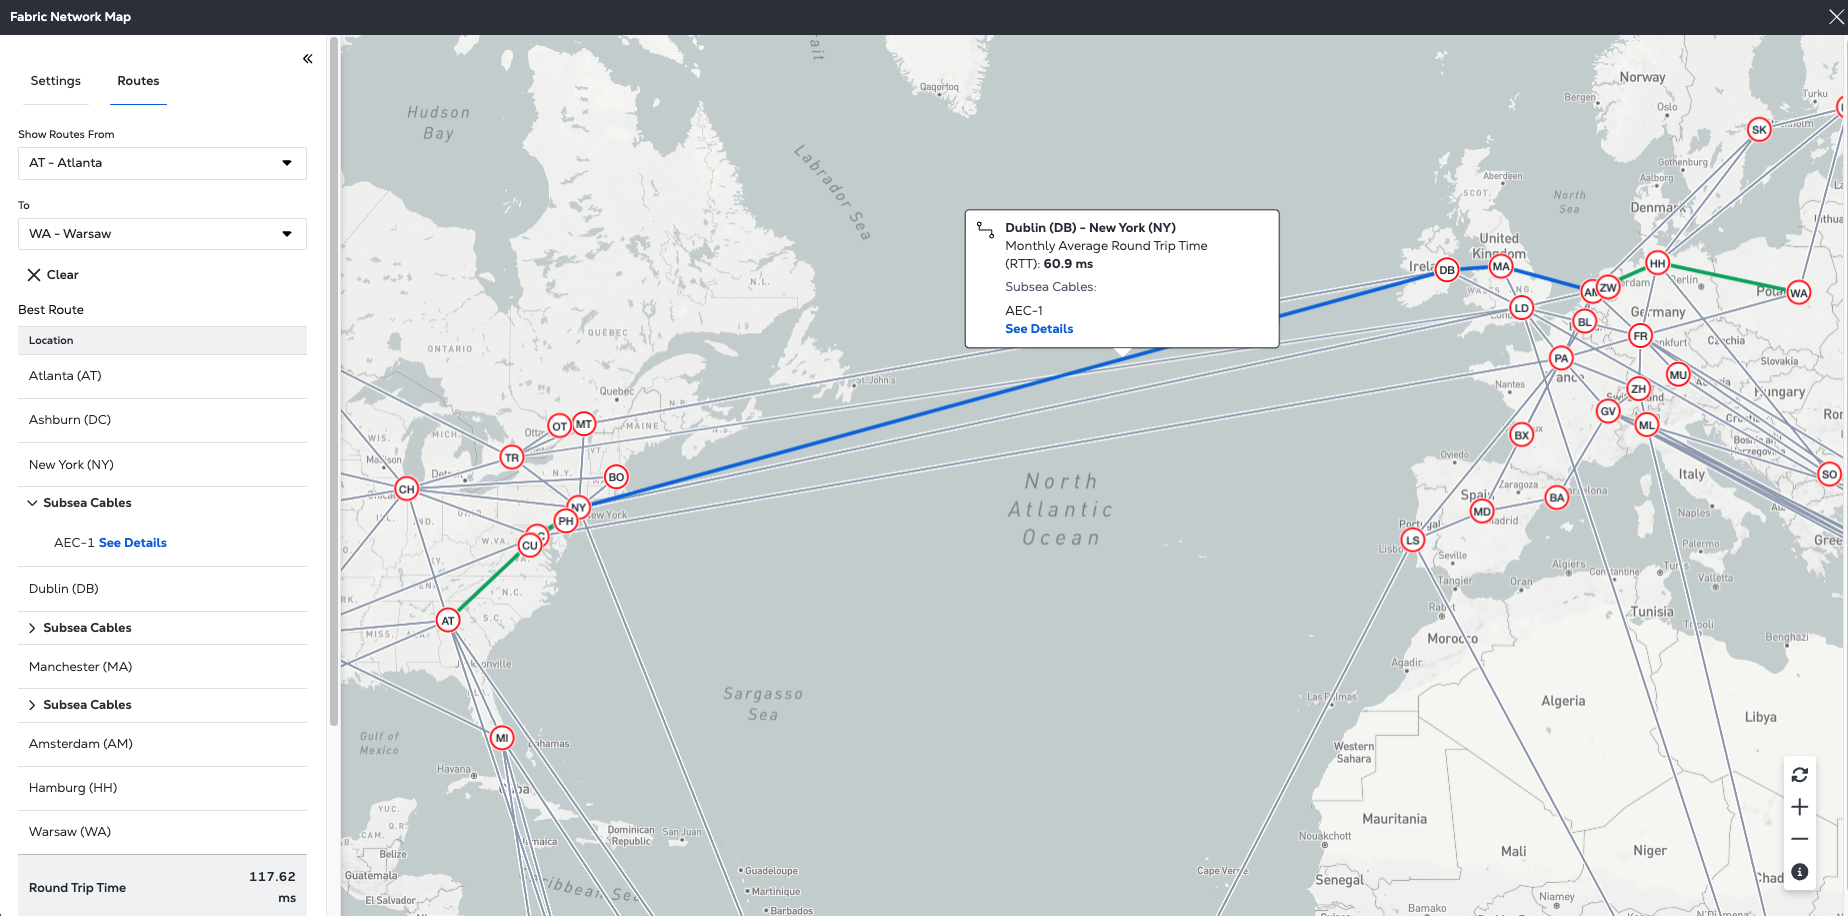
The Routes map feature also provides the user with the ability to view any subsea cable system that the connection is traversing.
This can be viewed in either the hop-by-hop routing information by expanding on the chevron:
Or by hovering over any of the utilized links on the map to see this information in the tooltip:
Latency Smart Alert History
Using historical metro latency data, machine learning services automatically detect anomalies in metro-to-metro latency when latency increases beyond the expected norm giving users the ability to quickly and readily identify latency conditions between any two given metros in the last 24 hours, providing the insight to correlate historical latency performance of their service to network conditions.
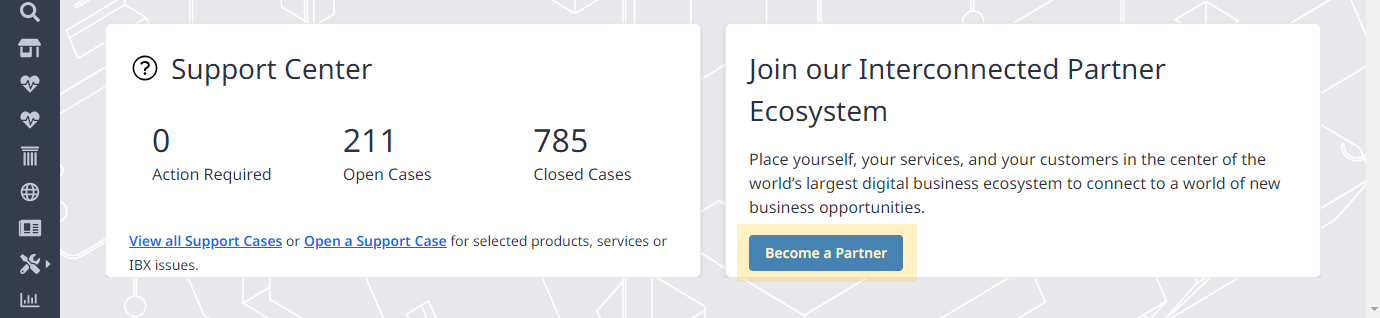
Support Center
View your support requests statistics, open a support case, or access the support center.
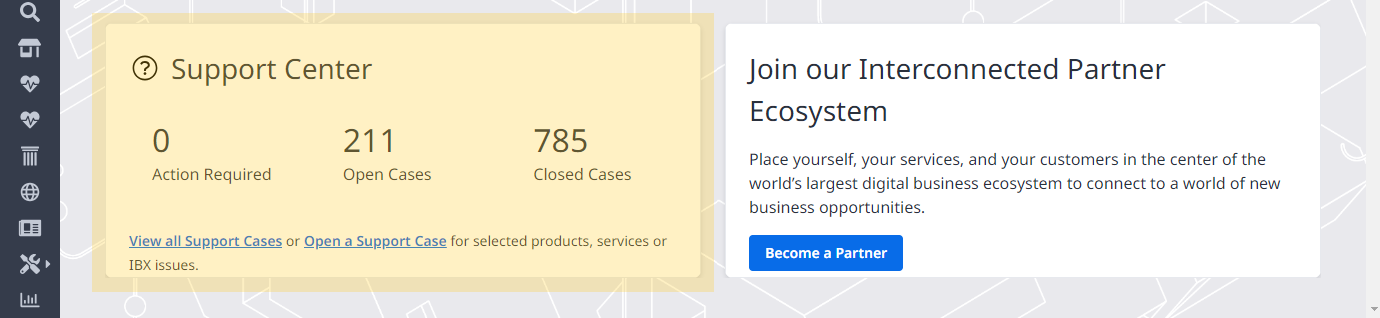
Become a Partner
Click Become a Partner to create a service profile and make your services available on the Equinix platform.
Edit Dashboard
Customize your Fabric dashboard layout to gain quicker access to data and features that are the most important to you.
To customize your dashboard:
-
Log in to the Customer Portal > Fabric Dashboard.
-
Click Edit Dashboard.
-
Rearrange widget tiles, then click Save.
tipYou can change the position of a tile within the section it's in.
noteYour dashboard layout is stored locally in your browser's cache. Clearing the cache will restore the dashboard to the default layout.