Service Insight Dashboard
Equinix Service Insight (ESI) is an incident dashboard. It provides a central location to view any IBX-related or product-related incidents that may affect you.
Login credentials for the Equinix Customer Portal. See Sign Into the Equinix Portal.
Permissions for IBX Services Notifications (specifically, the options for Can view and subscribe to IBX Notifications and Can view and subscribe to Network Notifications). To learn how to request these, see Permissions.
To view all incidents for Equinix Fabric and Network Edge products, you also need the Virtual Asset Notification Permission.
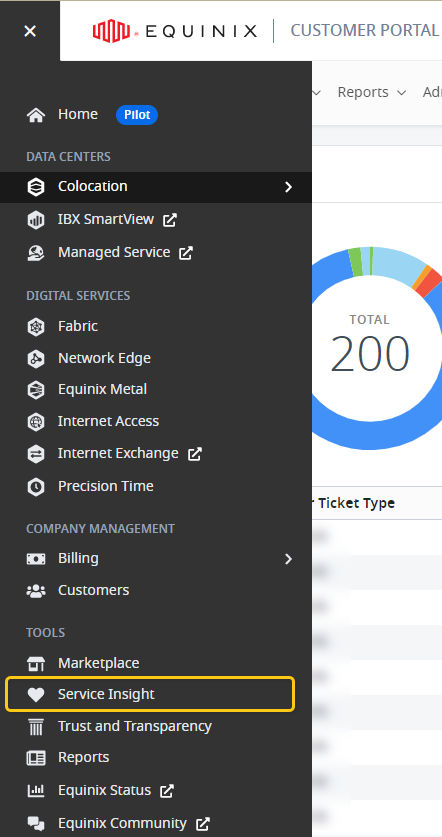
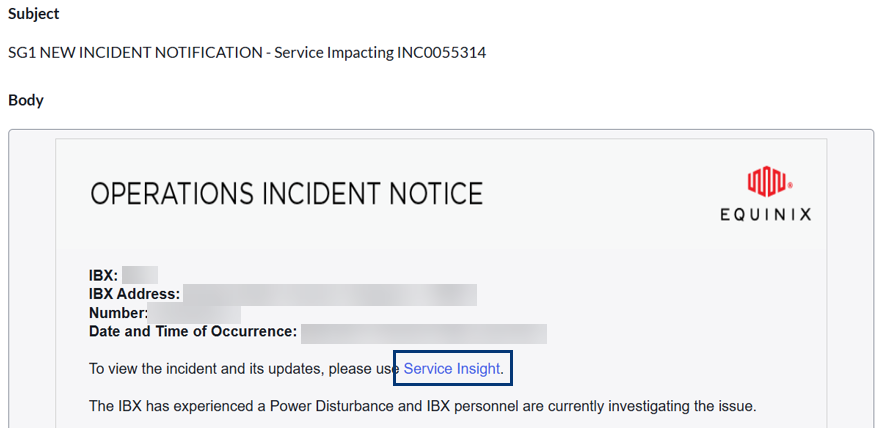
To open the Service Insight dashboard:
To view the dashboard from any screen in Service Insight, click (top-left corner of screen).
On the dashboard, you can choose from two views: IBX Locations and Equinix Products.
Each IBX and each product on the dashboard is represented by a tile.
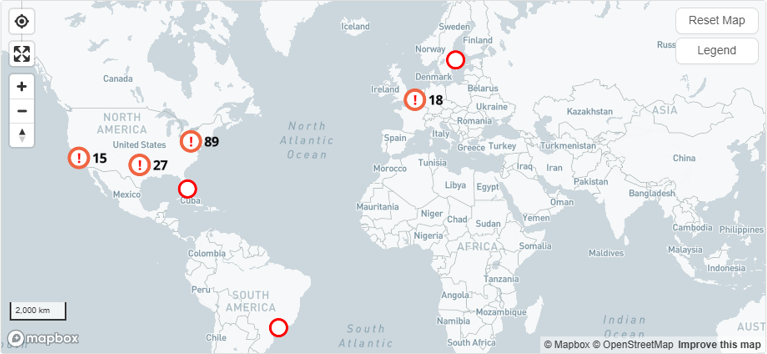
IBX Locations View
The IBX view shows the current status of your IBXs:
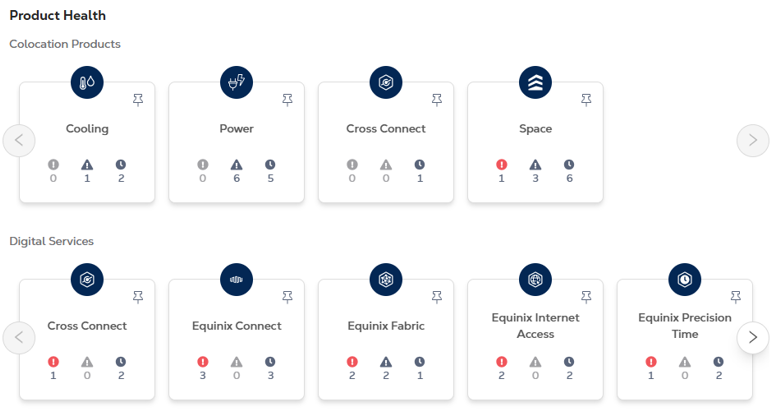
Equinix Products View
The Product view shows the current status of your products:
IBX & Product Statuses
Each IBX or product is marked as Healthy, Affected, or Resolved:
There are active incidents. | ||
There are no active incidents. The most recent incident was resolved within the last 24 hours. | ||
There are no active incidents. The most recent incident was resolved more than 24 hours ago. |
Note: Status information is customized for you. If you're affected by the incident, you'll see a status of Affected or Resolved (as appropriate). If you're not affected, you'll see a Healthy status.
Filtering the Dashboard
To quickly identify the most important incidents, click Only Service Impacting:
When enabled, this option:
-
Hides tiles that have a status of Healthy or Resolved.
-
Hides tiles that only have non-service-impacting incidents.
-
Shows all tiles that have service-impacting incidents.
On the IBX Locations tab, you can further refine your dashboard by selecting one or more filter options:
Filters | Description |
---|---|
IBX Locations |
Shows data centers in the selected global regions or metros. Tip: AMER = North America and South America; APAC = Asia-Pacific; EMEA = Europe, Middle East, and Africa. |
Incident Type |
Shows IBXs with incidents of the selected category (IBX or Network). |
IBX Status |
Shows IBXs with the selected health status (Affected, Resolved, Healthy). For descriptions of these, see IBX Statuses above. |
Tile Indicators
Each tile shows three icons, with a number below each icon:
Incident Type | Icon | Description |
---|---|---|
Service-Impacting A service-impacting incident is one that affects the Equinix services delivered to you. (It does not refer to the customer’s service status.) |
There are active service-impacting incidents. |
|
There are no service-impacting incidents. |
||
Non-Service-Impacting
A non-service-impacting incident is one that does not affect Equinix-delivered services. Equinix service is confirmed to be available or restored. |
There are active non-service-impacting incidents. |
|
There are no non-service-impacting incidents. | ||
Recently Resolved
Incidents that have been resolved within the last 24 hours. |
There are recently resolved incidents. | |
There are no recently resolved incidents. |
The main server is under repair; but because the backup servers are operational, services are not impacted.
The main communications link between two IBXs is down; but because traffic is being routed through an alternate link, services are not impacted.
Viewing the Incidents for an IBX or Product
To view the incidents, click the icon for the type you want to view:
A window shows a summary of the incidents, categorized into three tabs for Service Impacting, Non-Service Impacting, and Recently Resolved:
To see more details about an incident, click the incident title in the summary.
Tip: The incidents on each tab are shown in descending order by the date/time of the most recent update.
To see more details about an incident:
-
Click an incident title on the incident summary window (accessed from the dashboard).
-
Click an incident title from the All Incidents list.
or
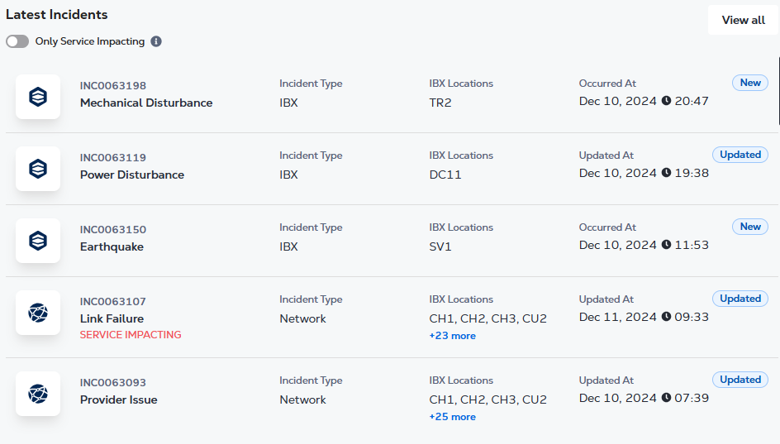
The incident detail screen shows:
Field | Description | ||||||||
---|---|---|---|---|---|---|---|---|---|
Service Impacting |
Whether Equinix-delivered services are/were impacted by the incident (Yes or No). |
||||||||
Status |
Current status of the incident (New, Updated, or Resolved). |
||||||||
Start Time |
Date/time the incident occurred. |
||||||||
Reported |
Date/time the incident was reported. |
||||||||
Resolved |
Date/time the incident was resolved. |
||||||||
Incident Type |
The incident type (IBX or Network). |
||||||||
Incident Number |
A unique ID for the incident. |
||||||||
Affected Products |
Such as Equinix Connect, Internet Exchange, Metro Connect, Colocation, Equinix Precision Time, etc. |
||||||||
IBX Locations |
The affected data center sites. |
||||||||
Asset Type |
(IBX incidents only) The asset types are: AC Circuit, ATS, Cabinet, Cage, Cooling Zone, DC Circuit, DC Plant, Floor, Network Cable Connection, Patch Panel / Media Converter Chassis, PDU / RPP, Phase, Room, STS, Switch Gear, Transformer, UPSH, UPSR, UPSS. |
||||||||
Asset Category |
(IBX incidents only) Electrical, Mechanical, Cross Connect, or Location. |
||||||||
Affected Assets |
(IBX incidents only) Such as a cage number or other asset ID. |
||||||||
Current Condition |
(IBX incidents only) Such as Normal and Monitoring, Cable Unplugged, Loss of Redundancy, Loss of Communications, Fire / Smoke Alarm, Loss of Power. |
||||||||
Affected Accounts |
The account numbers and names of the customers affected by the incident. Tip: To find a specific name or number, use the search box. To sort the list, click a column header. |
||||||||
Updates |
The right side of the window shows all updates to the incident, sorted by date/timestamp:
To toggle the sort order of the updates, click or . Tip: You can use your computer's Find function (for example, Ctrl + F for Windows) to search for specific text in the incident update messages. |
To see all incidents for your IBXs, click Incident List (top-left corner of Service Insight screen).
This list shows all the incidents (current and past) that may have impacted you.
The list includes the following information for each incident:
Column | Description |
---|---|
Incident Number |
A unique ID for the issue. |
Summary |
A brief description of the issue. |
IBX Locations |
The affected data center sites. |
Service Impacting |
Whether Equinix-delivered services are/were impacted by the incident (Yes or No). |
Incident Status |
The current status of the issue (New, Updated, or Resolved). |
Incident Type |
The category of the issue (IBX or Network). |
Affected Products |
Such as Equinix Connect, Internet Exchange, Metro Connect, Colocation, Equinix Precision Time, etc. |
Affected Asset Type |
(IBX incidents only) The asset types are: AC Circuit, ATS, Cabinet, Cage, Cooling Zone, DC Circuit, DC Plant, Floor, Network Cable Connection, Patch Panel / Media Converter Chassis, PDU / RPP, Phase, Room, STS, Switch Gear, Transformer, UPSH, UPSR, UPSS. |
Occurred At |
The date/time the incident occurred. |
Updated At |
The date/time of the last update for this issue. |
Sorting the List
You can sort the list by any column. The currently sorted column is indicated by a blue arrow ( ). To sort by a different column, click the up/down arrows ( ) for that column. You can click again to toggle between ascending and descending order.
Searching the List
Use the Search incidents box to search all the columns for a word or string. For example:
Tip: You can search using full or partial words. Search terms are not case-sensitive.
Filtering the List
You can quickly filter the list using these options at the top:
-
IBX Locations – Select one or more sites.
-
Service Impacting – Select Yes or No.
Or click All Filters for more options:
Choose your filters and click Apply.
Exporting the List
To retain a copy for your records, you can save the list to a CSV (comma-separated values) file. You can open the export file in programs such as Microsoft Excel or Google Sheets, where you can perform other actions on the data (sort, filter, hide rows/columns, create charts, etc.).
-
Use the filters and/or search box to select the incidents you want to export. (If you don't refine the list, the entire list is exported.)
-
Click Export CSV to download the file to your computer or device.
Get Support
For questions about Service Insight or a specific incident, you can contact your Customer Success Manager (CSM) or the Global Service Desk (GSD), or you can open a support case through the portal (see Customer Support).
Submit Product Feedback
For comments or suggestions about Service Insight, click the Feedback button on the right edge of the Service Insight page, or send email to Product Feedback.
Submit General Feedback
For general questions or comments about our company, products, and services, go to Tell Equinix – We're Listening.