Monitor Connection Utilization
Monitor your connection utilization and ensure sufficient bandwidth for your customers or optimize your ports usage.
To view connection utilization statistics:
-
Log in to the Customer Portal > Fabric Dashboard.
-
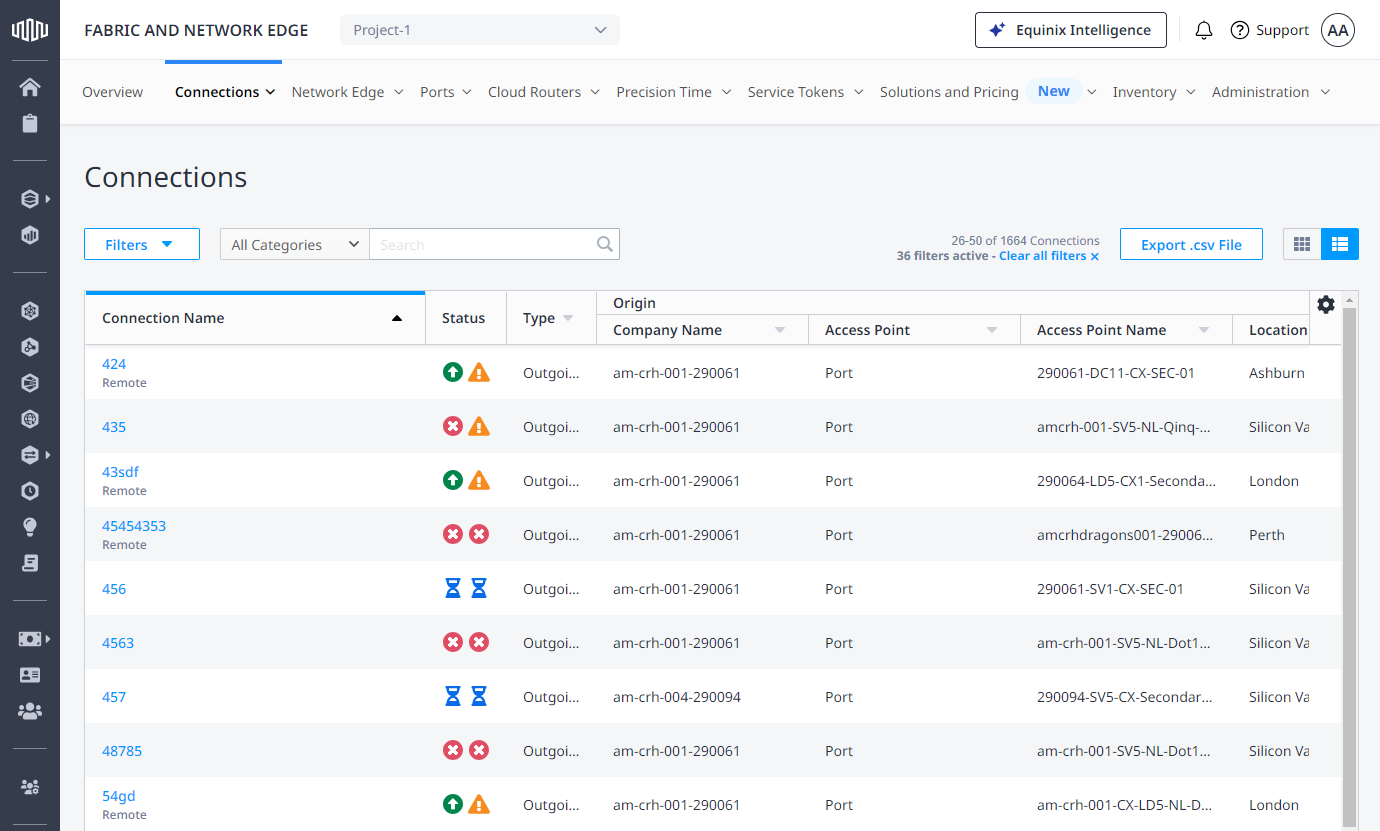
From the Connections menu, select Connections Inventory.
-
Locate and click the connection you want to monitor.
-
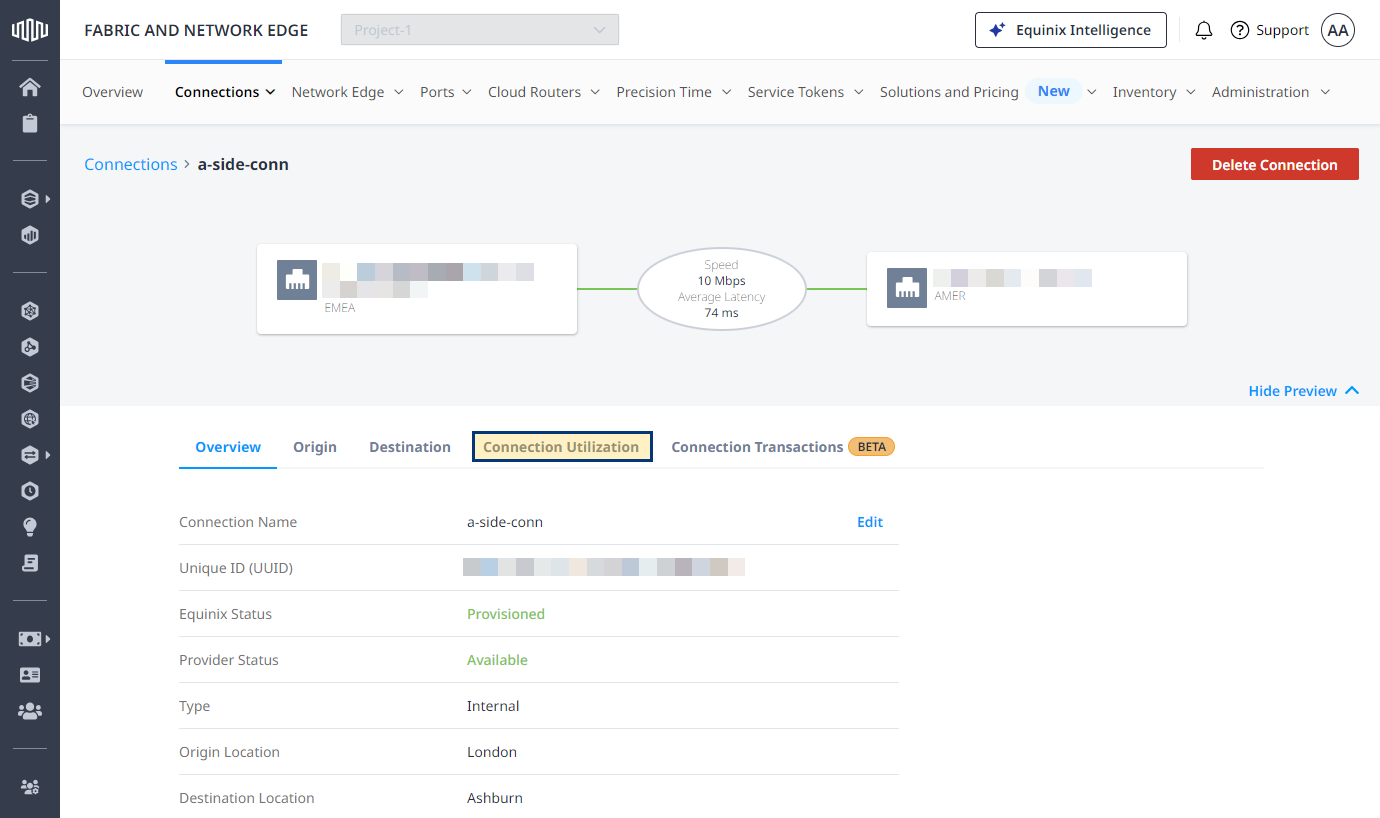
Select the Connection Utilization tab to view the traffic statistics.
Graphs for inbound and outbound traffic are displayed. By default, the time period that displays is Last 7 Days.
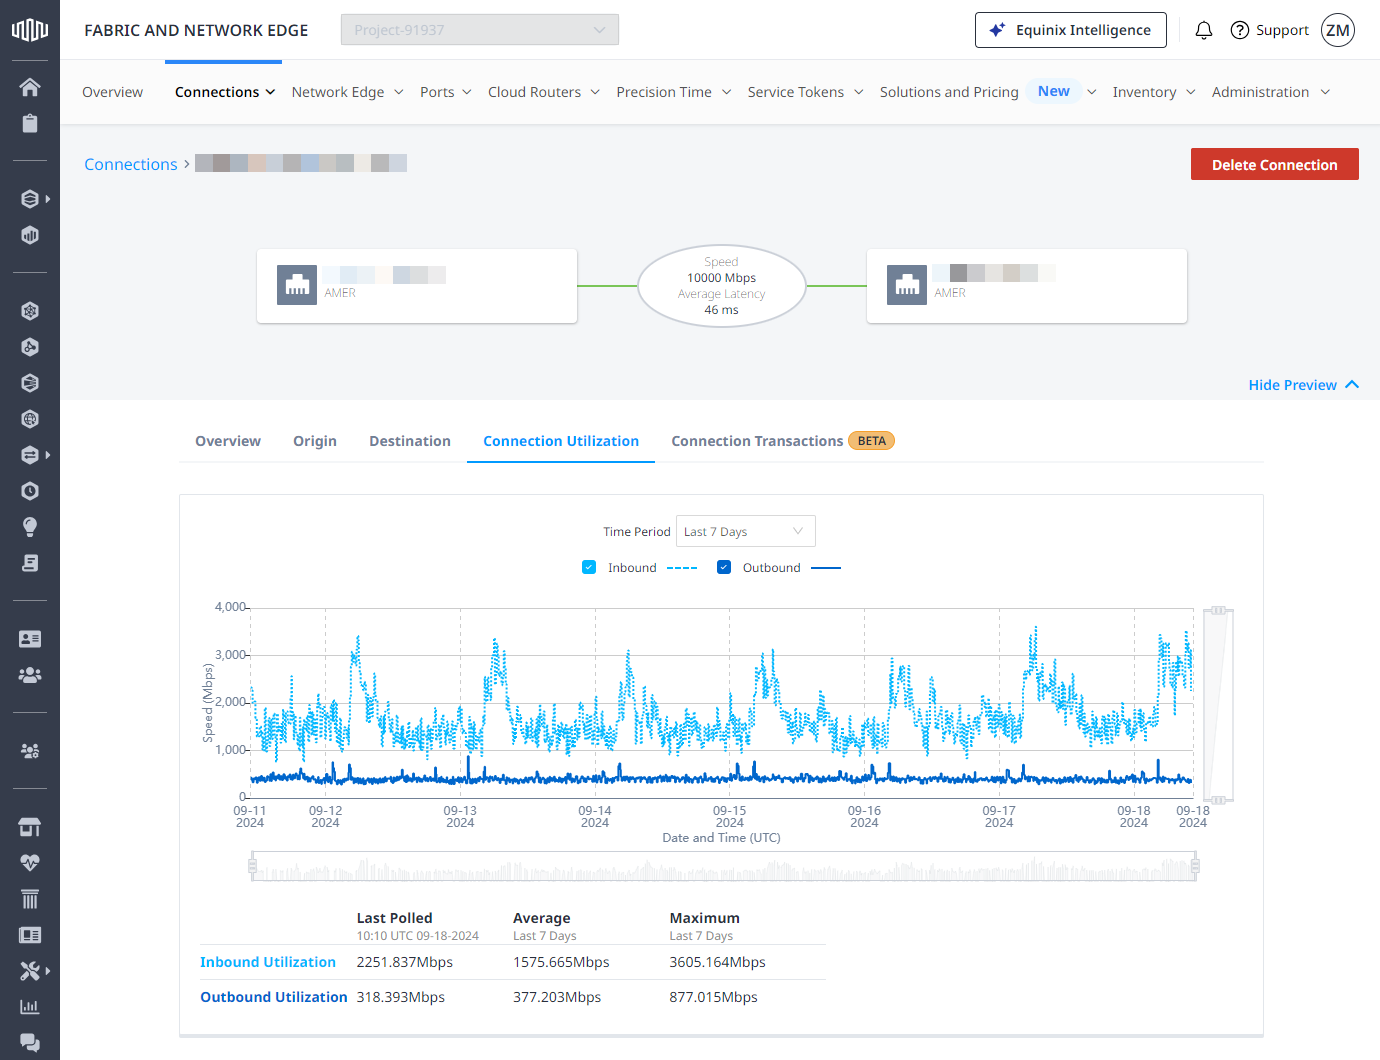
Use the sliders at the bottom and to the right of the graph, to change the scale. Hover over a the graph to see traffic readings in a specific timestamp.
From the Time Period drop-down list, select a predefined setting or choose Custom Date Range to define your own time interval.