Service Insight Dashboard
The Service Insight Dashboard provides a central location to view any IBX-related or product-related incidents that may affect you.
Accessing Service Insight
To access Service Insight, you need:
-
Credentials for the Equinix Customer Portal. If you need to create an account, see New Customer Onboarding
-
Permissions for IBX Services Notifications. Specifically, the options for Can view and subscribe to IBX Notifications and Can view and subscribe to Network Notifications. To learn how to request these, see Permissions.
-
To view all incidents for Equinix Fabric and Network Edge products, you also need the Virtual Asset Notification Permission.
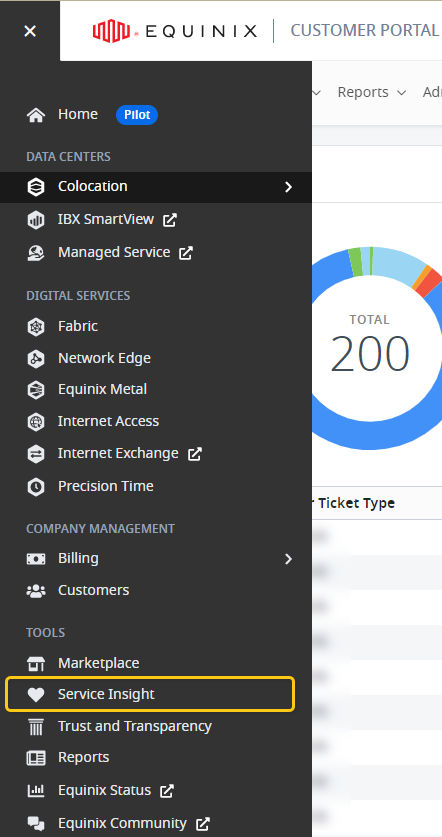
To open the Service Insight dashboard, click Service Insight from the main portal navigation menu:
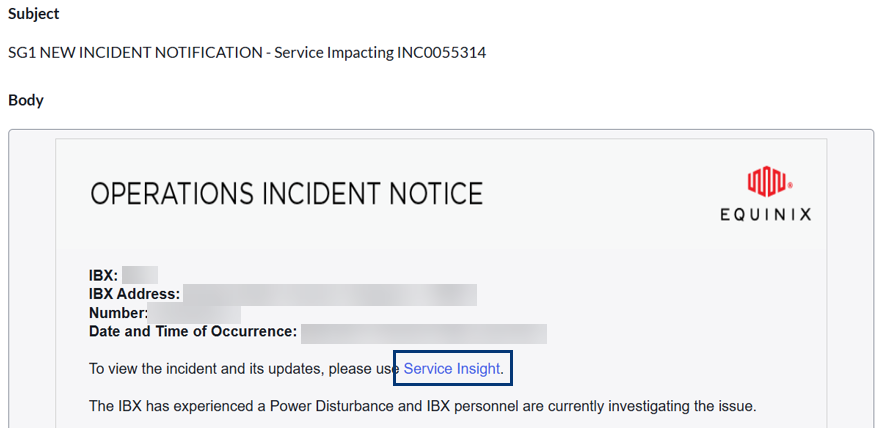
If you received a notification email about an incident, click Service Insight from the email. (If you're not already signed into the Customer Portal, you are asked to sign in.)
Overview Page
The Overview page provides a high-level view of your services and incidents.
Active Incidents
This section displays a listing of active issues categorized as Service Impacting, Non-Service Impacting, and Under Investigation. You can see the daily change in incidents, indicating whether there has been an increase or decrease in instances.
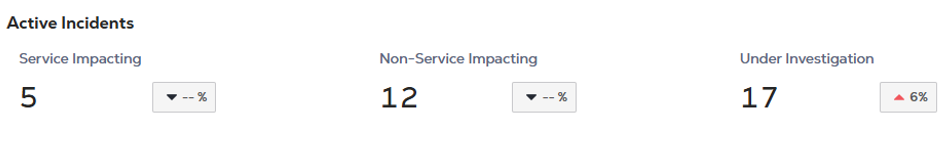
Incident Types:
-
Service-Impacting - A service-impacting incident is one that affects the Equinix services delivered to you. (It does not refer to the customer’s service status.)
-
Non-Service-Impacting - A non-service-impacting incident is one that does not affect Equinix-delivered services. Equinix service is confirmed to be available or restored.
-
Under Investigation - Incidents that are still under investigation
Note:
Examples of incidents that do not impact services:
-
The main server is under repair; but because the backup servers are operational, services are not impacted.
-
The main communications link between two IBXs is down; but because traffic is being routed through an alternate link, services are not impacted.
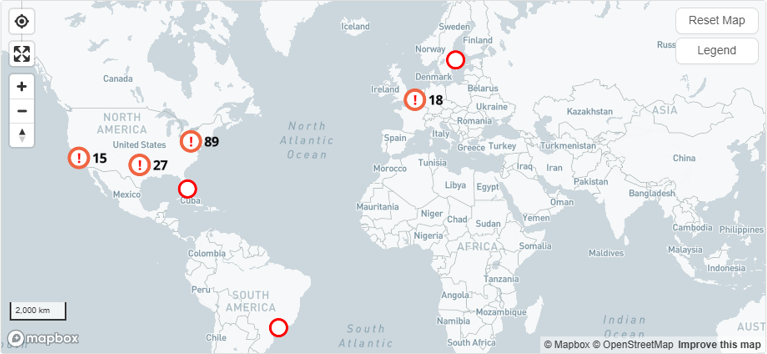
Geographical View
The incidents are represented by circles on a map, indicating their location. An exclamation point inside a circle signifies a service impacted in that location. You can zoom in to decluster the incidents and click on a location to see a breakdown by Metro.
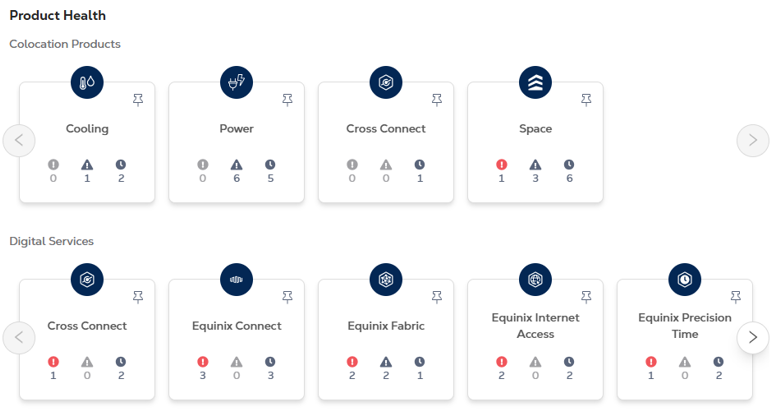
Product Health
This section provides insights into your colocation and digital services. Colocation incidents are categorized based on issue classification, giving you a product-like view. Clicking on a category provides a breakdown of services and a listing of current incidents.
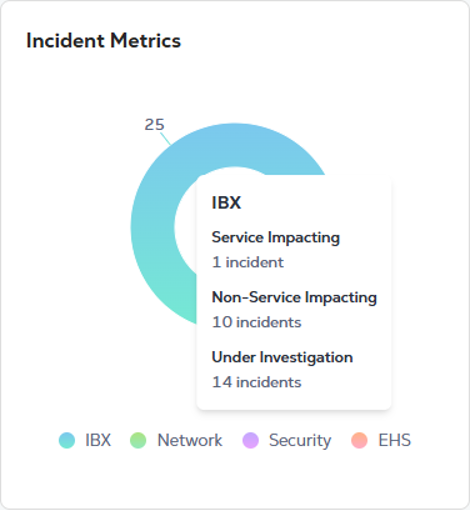
Incident Metrics
The Incident Metrics section gives you a quick overview of incidents broken down by type. You can see the ratio of IBX, network, security, and EHS incidents at a glance. Hovering over the metrics provides additional details.
Viewing the Incidents for an Incident Type
To view the incidents, click the icon for the type you want to view.
![]()
A window shows a summary of the incidents, categorized into three tabs for Service Impacting, Non-Service Impacting, and Under Investigation.
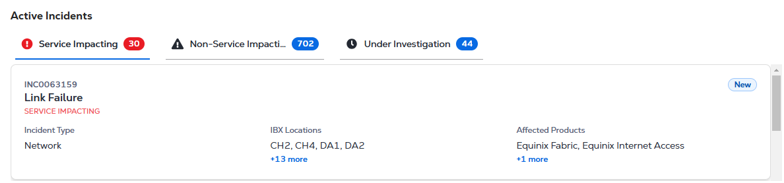
To see more details about an incident, click the incident card.
The incidents on each tab are shown in descending order by the date/time of the most recent update.
Latest Incidents
The Latest Incidents section displays the top 5 most recently updated or added incidents. You can hover over them to view additional details. Use the filter option to narrow down the incidents based on service impacting.
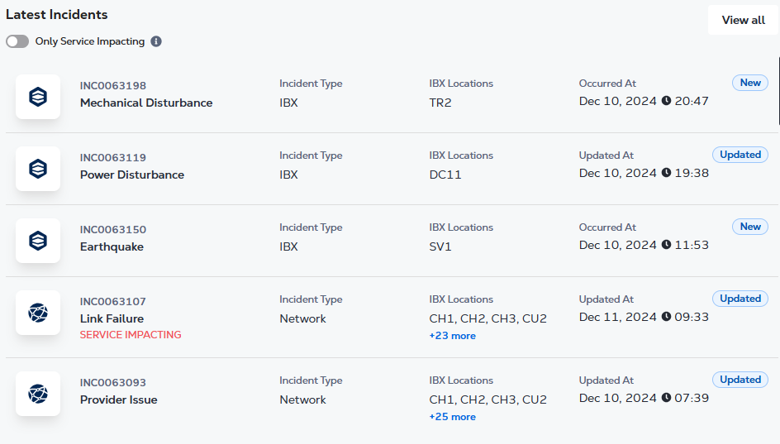
Clicking on an incident from the Latest Incidents section or the Geographical View takes you to the Incident Details view.
Support and Feedback
For questions about Service Insight or a specific incident, you can contact your Customer Success Manager (CSM) or the Global Service Desk (GSD), or you can open a support case through the portal (see Customer Support).
For comments or suggestions about Service Insight, click the Feedback button on the right edge of the Service Insight page, or send email to Product Feedback.
For general questions or comments about our company, products, and services, go to Tell Equinix – We're Listening.