Viewing System Alerts - Active and Historical
Use the System Alerts screen to view the triggered system alerts for your assets.
The system delivers 99.9% of all system alert notifications within 60 seconds after collecting the alarmable reading from a sensor in the data center. You can see these near real-time updates:
- via the System Alerts screen's live feed feature (if enabled)
- via banner notifications (if enabled)
- via email/SMS notifications (if enabled)
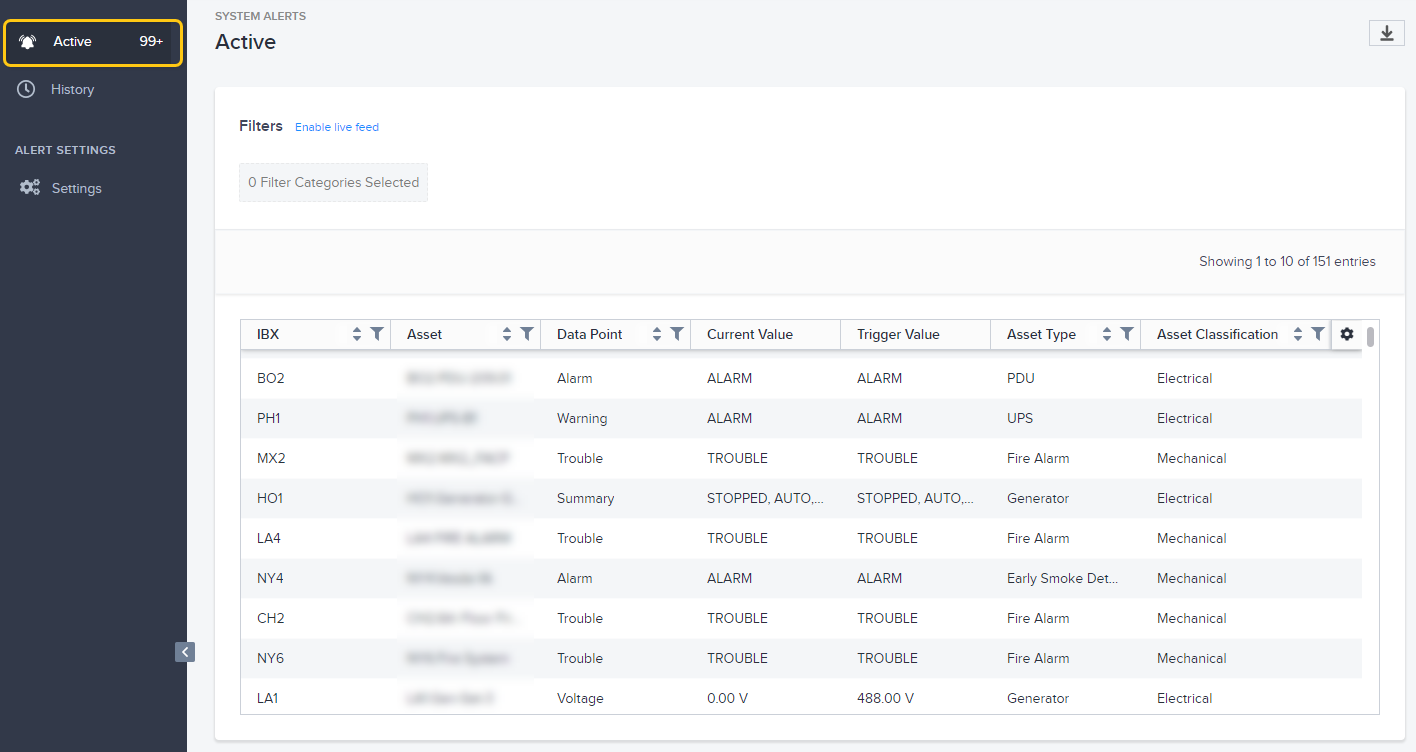
By default, when you go to the System Alerts screen, the system shows Active alerts.
To see past (inactive) alerts, click History.
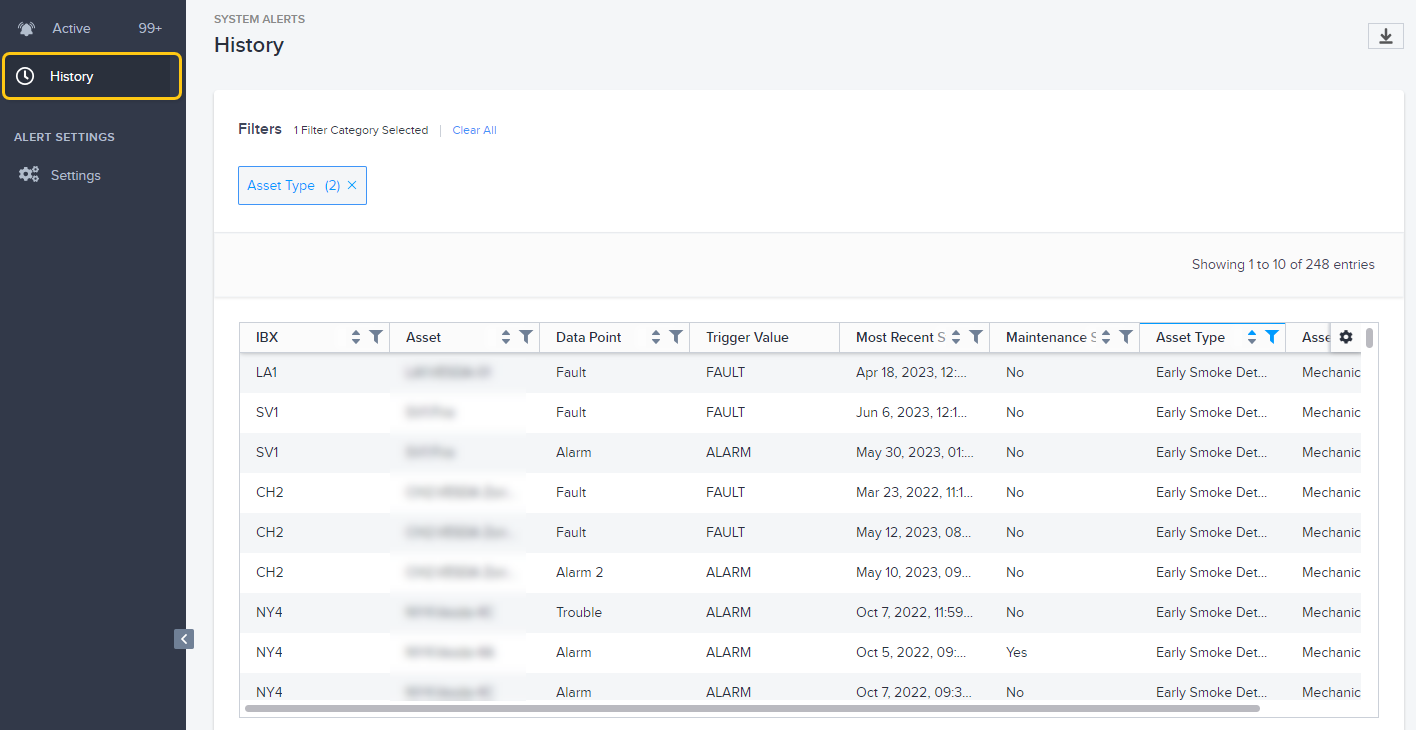
When an active alert condition resolves, the alert moves from the Active view to the History view. The system retains historical alert data for one year.
Data Columns
The columns on both screens are:
| Name | Description |
|---|---|
| IBX | The IBX code. The system only shows the data centers for which you have a Smart View subscription. |
| Asset | Unique ID of the asset. |
| Data Point | Name of the alert data point. |
| Current Value | Only shown for active alerts. |
| Trigger Value | Operating threshold at which the alert was triggered for this asset. |
| Most Recent Triggered Time | Date and time the alert was last triggered for this asset, displayed in your local time zone. Tip: To change the time zone displayed, see User Preferences. |
| Maintenance Status | Indicates whether the asset was undergoing maintenance work at the time of the alert (Yes or No). |
| Asset Type | Type of asset (such as Chiller, ATS, UPS, PDU, Generator, Fire Alarm). |
| Asset Classification | Asset category (Electrical, Environmental, or Mechanical). |
To sort the alert list by a particular column, click the column header.
View Alert Details
To see more details, click an alert row.
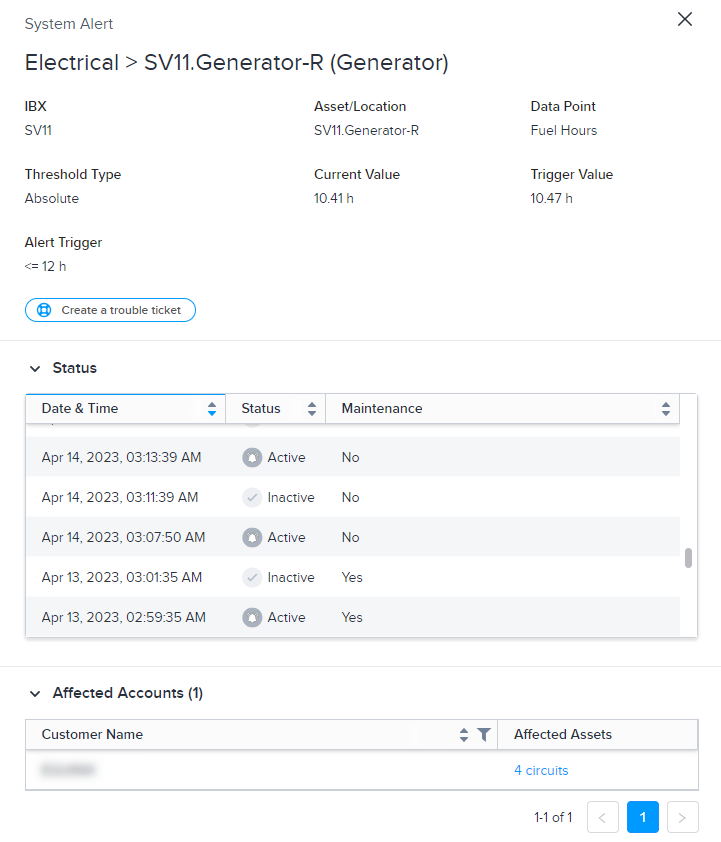
The detail window shows additional information, such as:
- The underlying data point that triggered the alert on the asset.
- The affected assets.
- The last year of activity for this alert on this asset. Rows with Inactive status indicate when the system resolved/cleared the alert.
Arrange the Data
The smart data grid allows you to filter, sort, and search the alert data. For example, you might want to show only the alerts for a specific asset or exclude all alerts triggered during a maintenance event.
You can also specify which columns you want to view and the order in which you want them to appear.
For details, see Smart Data Grids.
Export Data to a File
To save the data to a CSV file:
-
Arrange the data you want to export.
tipYou can set filters, use the search box, choose a sort column, hide columns, and rearrange columns.
-
Click the Download icon.
The system downloads a .csv file to your device.
Live Feed
If you enable the live feed, the screen automatically refreshes in real time.
- To turn on the auto-refresh feature, click Enable live feed.
- To turn off the auto-refresh feature, click Pause live feed.
Banner Notifications
If the live feed is enabled, you can also enable pop-up banner notifications. This feature displays alert messages in the top-right corner of the System Alerts screen:
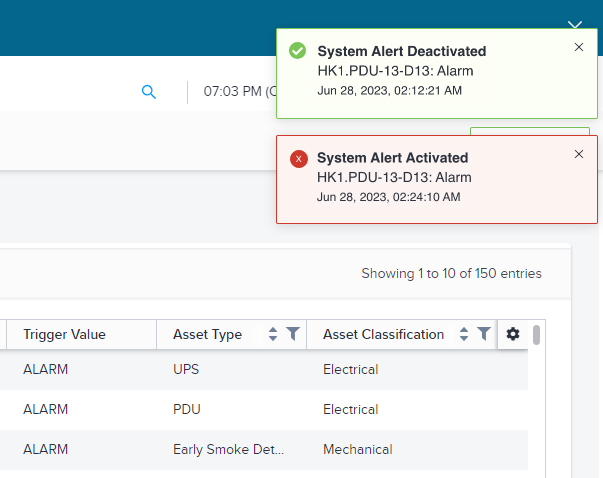
Red indicates a triggered (active) alert. Green indicates a resolved (deactivated) alert.
- To turn on banner notifications, click Enable notifications. If you don't see this option, click Enable live feed first.
- To turn off banner notifications, click Disable notifications.
Once enabled, you'll receive banner alerts for all system alerts related to your colocation footprint. (You don't need to be defined as a recipient on the Settings screen.)
Currently, banner notifications only appear on the Active page of the System Alerts screen.
To close a banner notification, click X.
The following options on the System Alerts Settings screen do not affect banner notifications:
- Disable Notification During Maintenance
- Enable Notification During Maintenance
- Enable Notification on Alert Activation Only
- Enable Notification on Alert Activation and Deactivation
Open a Trouble Ticket (For Active Alerts Only)
If you want to generate a trouble ticket for the asset that triggered the alert, click Create Trouble Ticket from the alert detail view. The system auto-populates the data point in the Additional Detail field:
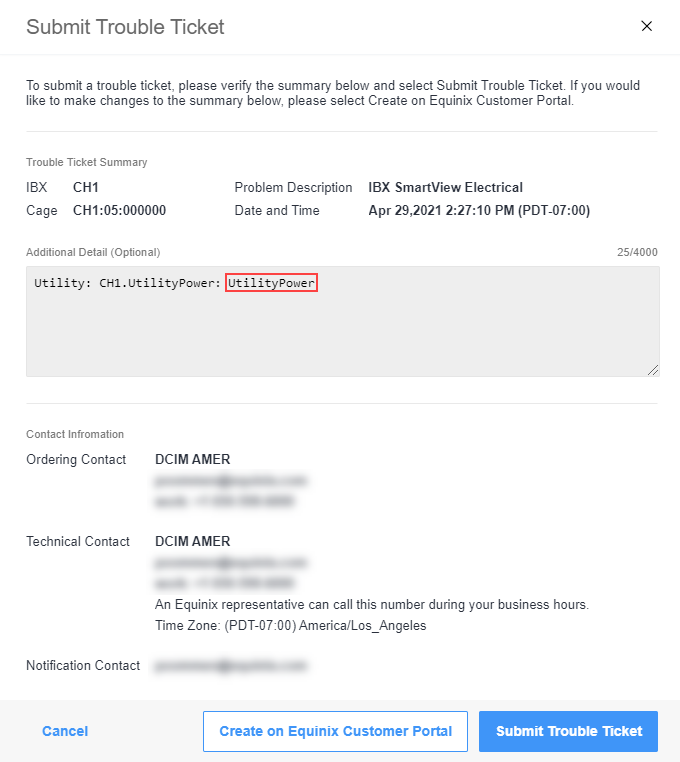
For more details, see Trouble Tickets.
Use Smart View APIs to View Active and Historical Alerts
If you want to view alerts in an API format, you can see the documentation in our system alerts API specification. For more information on getting started with the Smart View APIs and viewing alerts, see the get active alerts page.